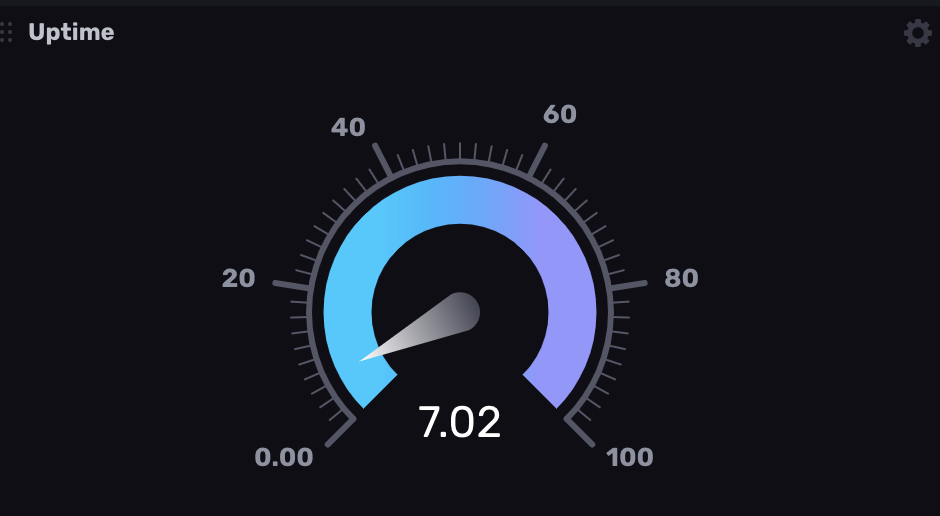
Gauge visualization
The Gauge visualization displays the most recent value for a time series in a gauge.

Select the Gauge option from the visualization dropdown in the upper left.
Gauge behavior
The gauge visualization displays a single numeric data point within a defined spectrum (default is 0-100). It uses the latest point in the first table (or series) returned by the query.
Queries should return one table
Flux does not guarantee the order in which tables are returned. If a query returns multiple tables (or series), the table order can change between query executions and result in the Gauge displaying inconsistent data. For consistent results, the Gauge query should return a single table.
Gauge Controls
To view Gauge controls, click Customize next to the visualization dropdown.
- Value Prefix: Prefix to add to the gauge value.
- Value Suffix: Suffix to add to the gauge value.
- Axis Prefix: Prefix to add to the gauge axis.
- Axis Suffix: Suffix to add to the gauge axis.
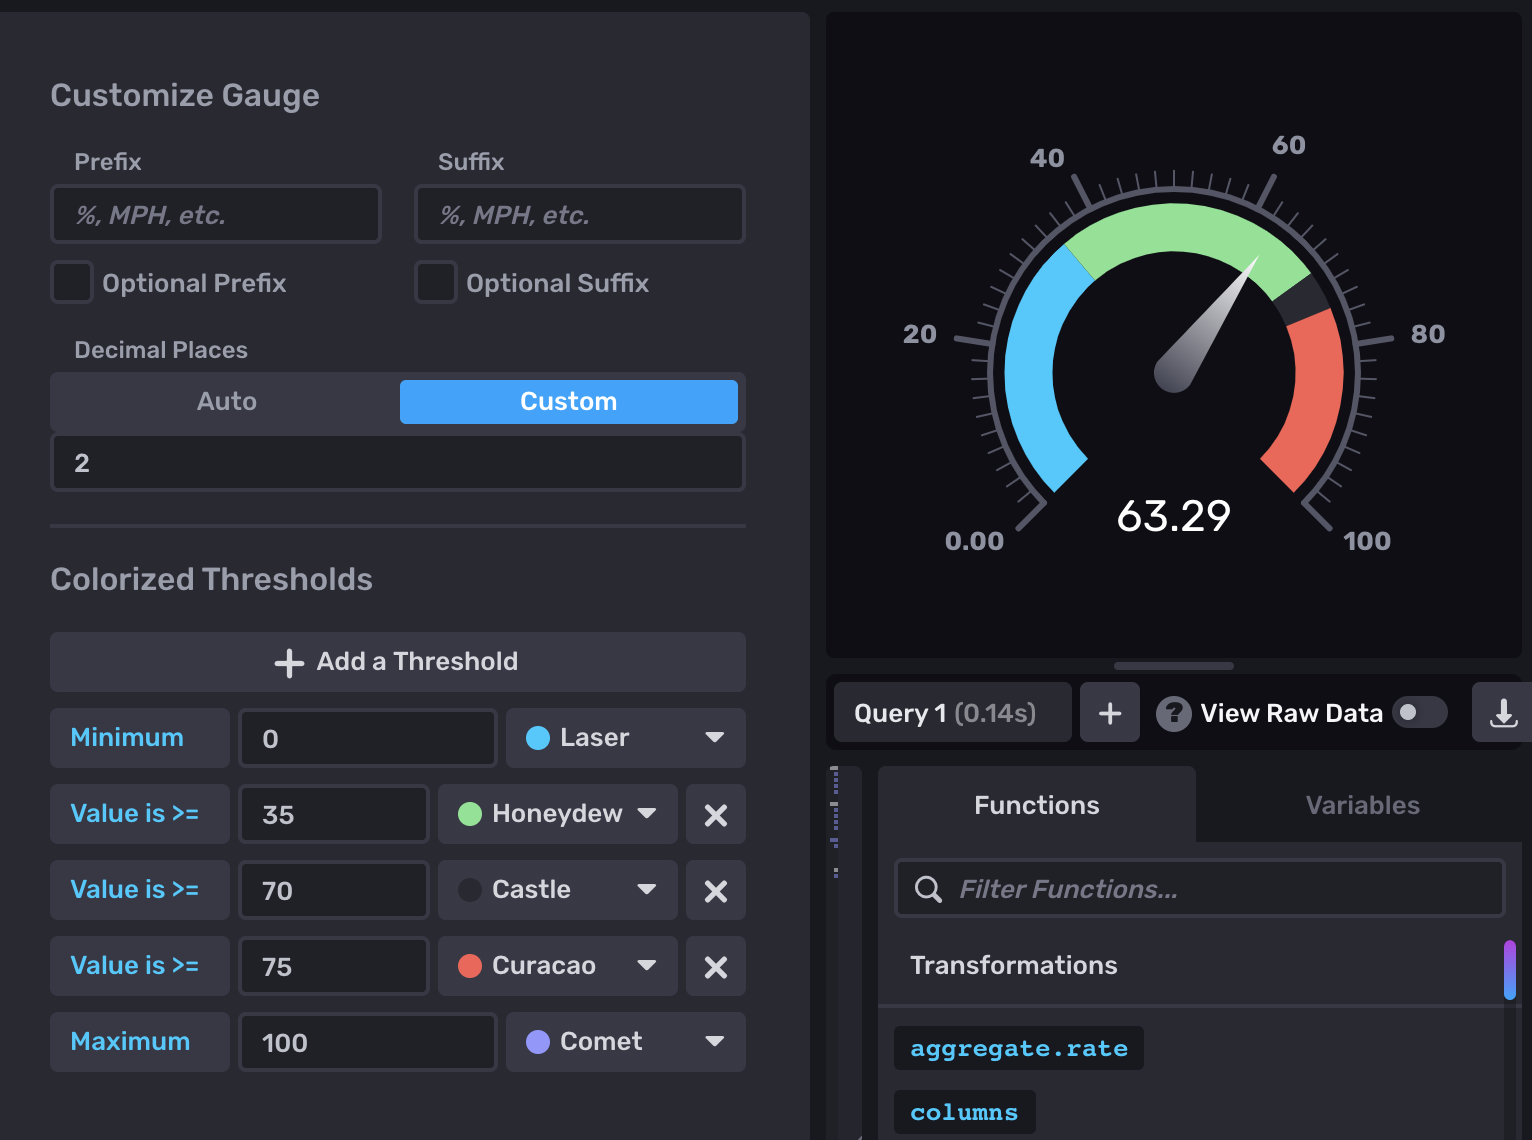
- Decimal Places: The number of decimal places to display for the gauge.
- Auto or Custom: Enable or disable auto-setting.
Colorized Thresholds
- Add a Threshold: Change the color of the gauge based on the current value.
- Minimum: Enter the minimum value at which the gauge should appear in the selected color. Choose a color from the dropdown menu next to the value.
- Maximum: Enter the maximum value at which the gauge should appear in the selected color. Choose a color from the dropdown menu next to the value.
Gauge examples
Gauge visualizations are useful for showing the current value of a metric and displaying where it falls within a spectrum.
Steam pressure gauge
The following example queries sensor data that tracks the pressure of steam pipes in a facility and displays it as a gauge.
Query pressure data from a specific sensor
from(bucket: "example-bucket")
    |> range(start: -1m)
|> filter(fn: (r) => r._measurement == "steam-sensors" and r._field == "psi" <INVALID_OP> r.sensorID == "a211i")Visualization options for pressure gauge

Was this page helpful?
Thank you for your feedback!
Support and feedback
Thank you for being part of our community! We welcome and encourage your feedback and bug reports for InfluxDB and this documentation. To find support, use the following resources:
Customers with an annual or support contract can contact InfluxData Support.
