
Control a dashboard
In the navigation menu on the left, select Boards (Dashboards).
Double-click a dashboard name to open it, and then do any of the following:
Add a cell
- Click Add Cell in the upper left hand corner to open the Data Explorer and configure a new cell for your dashboard.
- Click Name this cell , and enter a cell name.
- Create and submit your query.
- Click the check mark in the upper right hand corner to add the cell to the dashboard.
For details on using the Data Explorer, see Explore metrics.
Add a note
- Click Add Note to add a note cell to your dashboard.
- Enter your note in Markdown in the left pane. A preview appears in the right pane.
- Click Save.
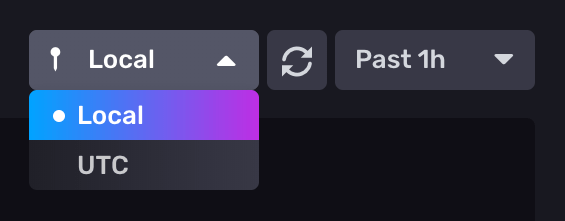
Select a timezone
From the timezone drop-down list, select the timezone to use for the dashboard–Local (default) or UTC.
Manually refresh a dashboard
- Click the refresh button () to manually refresh the dashboard’s data.
Automatically refresh a dashboard
- Click Set Auto Refresh, and then configure the following options:
- Select Indefinite to automatically refresh continuously, or select Custom to set a time to stop automatically refreshing.
- Refresh Interval: Enter how frequently the dashboard should refresh.
- Inactivity Timeout: Set how long the user should be inactive for the dashboard to time out and stop automatically refreshing.
- Click Confirm to save your changes.
Select the time range
Select from the time range options from the list.
Select Custom Time Range to enter a custom time range with precision up to nanoseconds. The default time range is 5 minutes.
The custom time range uses the selected timezone (local time or UTC).
Add variables
- Click Show Variables to display variables available for your dashboard. For details, see Use and manage variables.
View in presentation mode
- Click the ellipsis button, and then select Presentation Mode to enter presentation mode. Presentation mode lets you view a dashboard in full screen, hiding the left and top navigation menus so only the cells appear. This mode might be helpful, for example, for stationary screens dedicated to monitoring visualizations.
Toggle dark mode and light mode
Click the ellipsis button, and then select the moon or sun icons to toggle your dashboard between dark mode and light mode.

Was this page helpful?
Thank you for your feedback!
Support and feedback
Thank you for being part of our community! We welcome and encourage your feedback and bug reports for InfluxDB Cloud (TSM) and this documentation. To find support, use the following resources:
Customers with an annual or support contract can contact InfluxData Support.