Documentation

Histogram visualization

A histogram is a way to view the distribution of data. The y-axis is dedicated to count, and the X-axis is divided into bins.
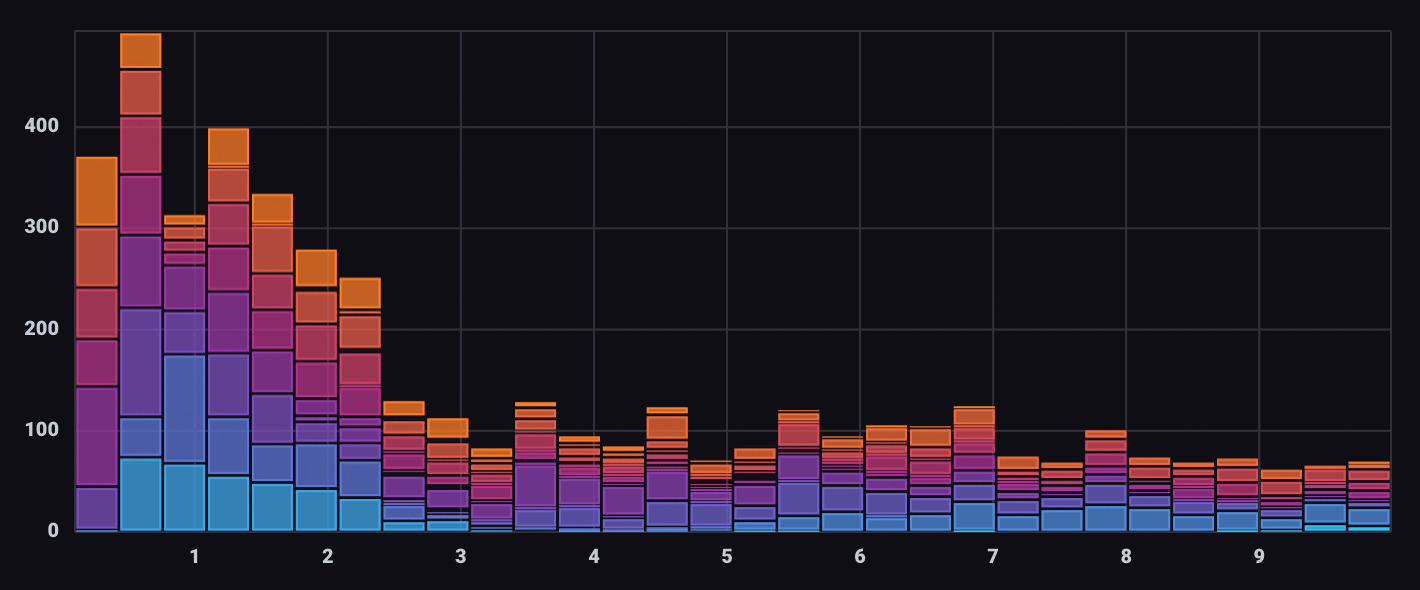
Histogram example

Select the Histogram option from the visualization dropdown in the upper left.

Histogram behavior

The Histogram visualization is a bar graph that displays the number of data points that fall within “bins” – segments of the X axis with upper and lower bounds. Bin thresholds are determined by dividing the width of the X axis by the number of bins set using the Bins option. Data within bins can be further grouped or segmented by selecting columns in the Group By option.

The Histogram visualization automatically bins, segments, and counts data. To work properly, query results should not be structured as histogram data.

Histogram Controls

To view Histogram controls, click Customize next to the visualization dropdown.

Data
  • X Column: The column to select data from.
  • Group By: The column to group by.
Options
  • Color Scheme: Select a color scheme to use for your graph.
  • Positioning: Select Stacked to stack groups in a bin on top of each other. Select Overlaid to overlay groups in each bin.
  • Bins: Enter a number of bins to divide data into or select Auto to automatically calculate the number of bins.
    • Auto or Custom: Enable or disable auto-setting.
X Axis
  • X Axis Label: Label for the x-axis.
  • X Axis Domain: The x-axis value range.
    • Auto: Automatically determine the value range based on values in the data set.
    • Custom: Manually specify the value range of the x-axis.
      • Min: Minimum x-axis value.
      • Max: Maximum x-axis value.
Hover Legend
  • Orientation: Select the orientation of the legend that appears upon hover:
    • Horizontal: Select to display the legend horizontally.
    • Vertical: Select to display the legend vertically.
  • Opacity: Adjust the legend opacity using the slider.
  • Colorize Rows: Select to display legend rows in colors.

Histogram examples

View error counts by severity over time

The following example uses the Histogram visualization to show the number of errors “binned” by time and segmented by severity. It utilizes data from the Telegraf Syslog plugin.

Query for errors by severity code
from(bucket: "example-bucket")
    |> range(start: v.timeRangeStart, stop: v.timeRangeStop)
    |> filter(fn: (r) => r._measurement == "syslog" and r._field == "severity_code")
Histogram settings

In the Histogram visualization options, select _time as the X Column and severity as the Group By option:
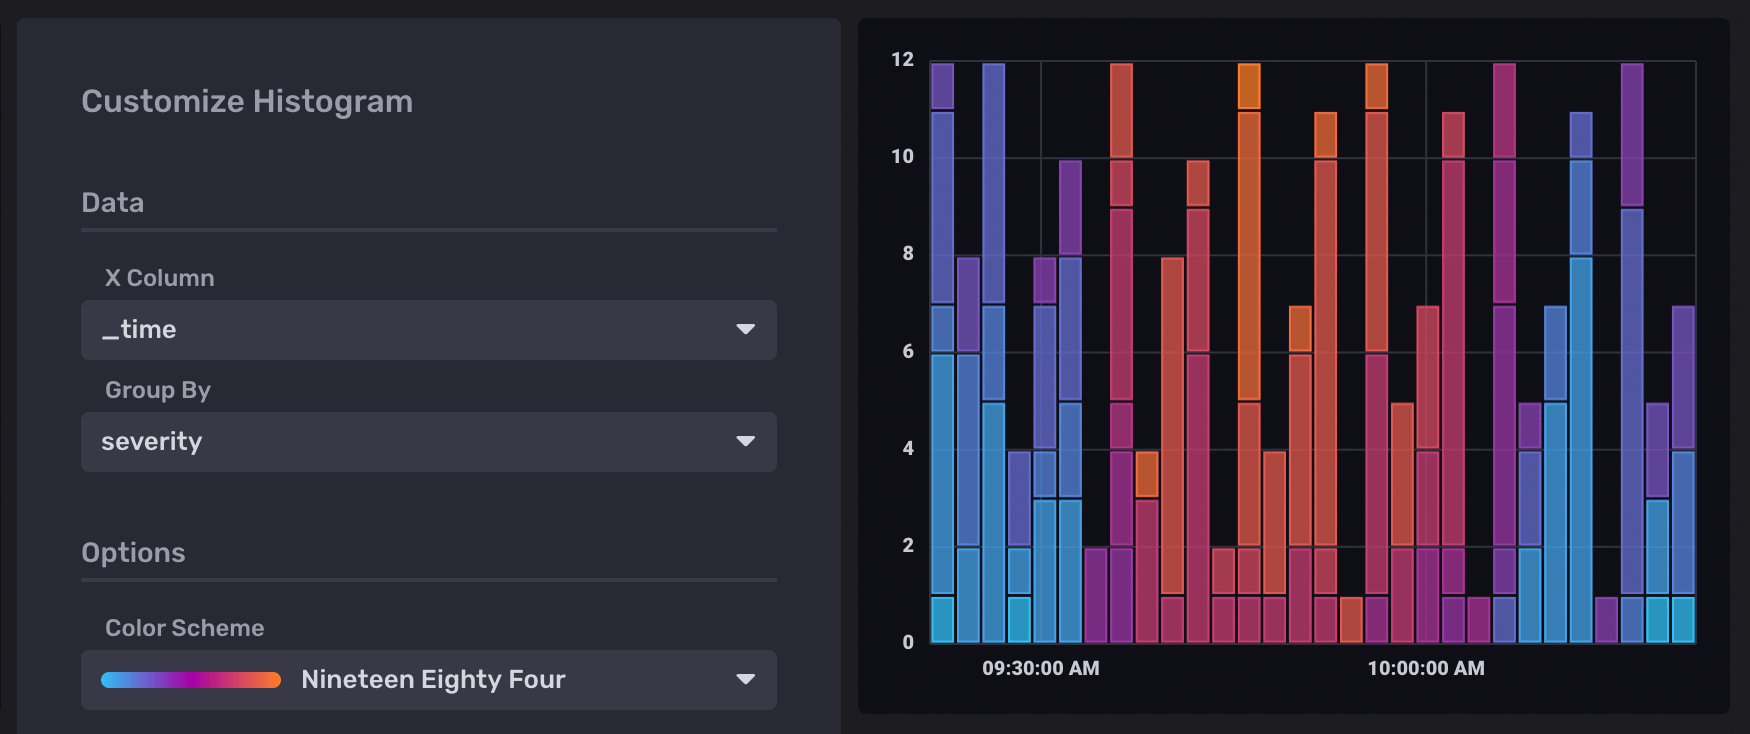
Errors histogram

Was this page helpful?

Thank you for your feedback!


InfluxDB OSS 2.9.0: API tokens are hashed by default

Stronger token security in InfluxDB OSS 2.9.0 — tokens are hashed on disk by default. Existing tokens are hashed on first startup and can’t be recovered afterward. Capture any plaintext tokens you still need before you upgrade.

View InfluxDB OSS 2.9.0 release notes

Hashed tokens authenticate exactly like unhashed tokens — clients and integrations keep working.

Also new in 2.9.0:

  • Configurable backup compression
  • Restore support for backups containing hashed tokens
  • Tighter Edge Data Replication queue validation
  • Flux upgrade
  • Compaction reliability improvements

Key enhancements in Explorer 1.9

Explorer 1.9 is now available with InfluxQL support, an AI-assisted Flux to SQL converter (beta), and new live sample data simulators.

View Explorer 1.9 release notes

Explorer 1.9 includes new features and improvements that make it easier to query, visualize, and manage data.

Highlights:

  • Flux to SQL converter (beta): Convert Flux queries to SQL with an AI-assisted converter.
  • InfluxQL support: Query data with InfluxQL in the Data Explorer and dashboards, and save and load InfluxQL queries.
  • InfluxQL visualizations: Render line and bar charts from InfluxQL results with per-tag series grouping.
  • Query error history: Review a history of query errors in the query tool.
  • Live sample data simulators: Generate continuous live sample data with new bird data and signal generator simulators.

For more details, see Explorer 1.9 release notes

InfluxDB 3.10 is now available

InfluxDB 3 Core 3.10 adds an automatic catalog format upgrade, a configurable query-concurrency limit, and processing engine improvements.

Key updates in InfluxDB 3 Core 3.10:

  • Catalog format upgrade: the on-disk catalog automatically upgrades from format v2 to v3 on first 3.10 startup. Migration is one-way—back up your catalog before upgrading.
  • --max-concurrent-queries: limit concurrent queries (adjustable at runtime).
  • GET /ready endpoint for readiness probes.
  • Processing engine: cross-database queries and trigger lockdown flags.

For more information, see the InfluxDB 3 Core release notes.

InfluxDB 3.10 is now available

InfluxDB 3 Enterprise 3.10 adds automated backup and restore, row-level deletions, and user management, with an automatic catalog format upgrade and performance preview improvements.

Key updates in InfluxDB 3 Enterprise 3.10:

  • Catalog format upgrade: the on-disk catalog automatically upgrades from format v2 to v3 on first 3.10 startup. Migration is one-way—back up your catalog before upgrading.
  • Automated backup and restore (beta)
  • Row-level deletions
  • User management (authentication and RBAC) — preview
  • Performance preview improvements

Backup and restore, row-level deletions, and the performance preview require the Enterprise storage engine upgrade (opt-in beta). Beta and preview features are subject to breaking changes and aren’t recommended for production use.

For more information, see the InfluxDB 3 Enterprise release notes

Telegraf Enterprise is now generally available

Telegraf Enterprise is now generally available, along with Telegraf Controller v1.0.

Telegraf Enterprise combines Telegraf Controller, a centralized management console for Telegraf, with official support from InfluxData. Manage configurations, monitor fleet health, and operate tens of thousands of Telegraf agents from a single system.

InfluxDB Docker latest tag changing to InfluxDB 3 Core

On September 15, 2026, the latest tag for InfluxDB Docker images will point to InfluxDB 3 Core. To avoid unexpected upgrades, use specific version tags in your Docker deployments.

If using Docker to install and run InfluxDB, the latest tag will point to InfluxDB 3 Core. To avoid unexpected upgrades, use specific version tags in your Docker deployments. For example, if using Docker to run InfluxDB v2, replace the latest version tag with a specific version tag in your Docker pull command–for example:

docker pull influxdb:2

InfluxDB Cloud powered by TSM