
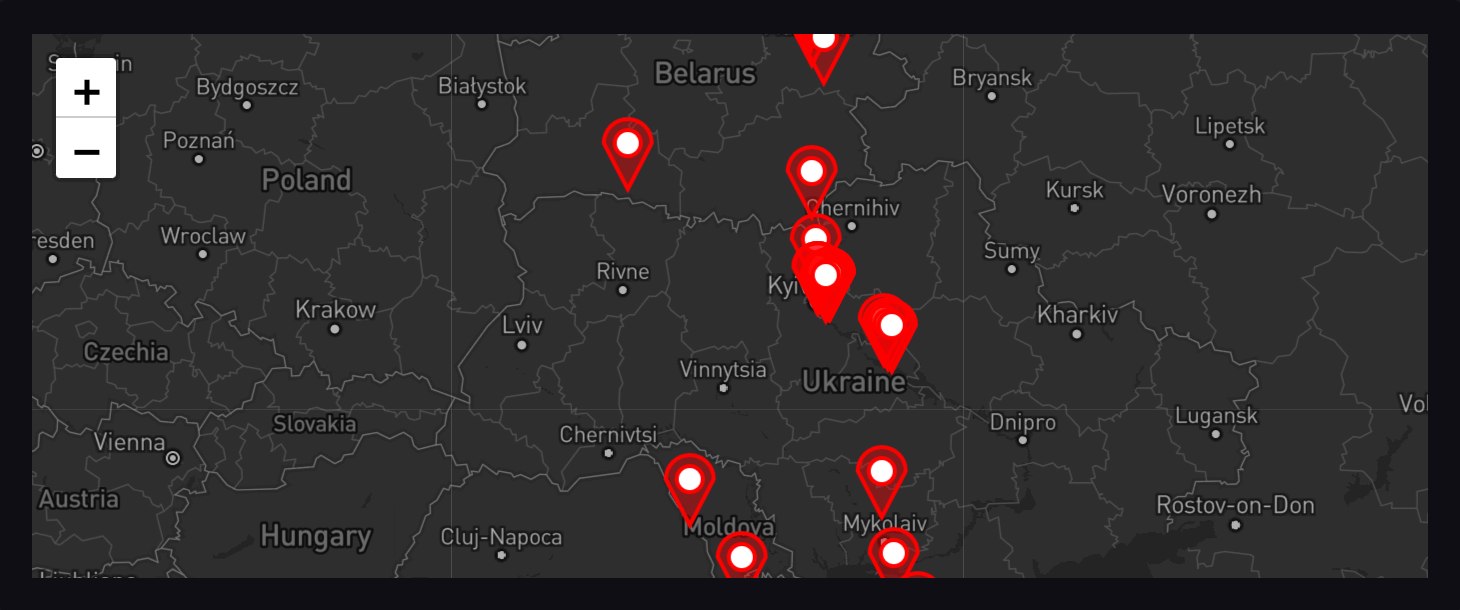
Map visualization
The Map visualization displays geo-temporal data on a geographic map.
Set up the Map visualization
To view geo-temporal data on a geographic map, set up a Map visualization.
Set up the Map visualization
Do one of the following:
Click Data Explorer in the navigation bar.
Click Dashboards in the navigation bar:
Click the name of the dashboard to update and then do one of the following:
- To edit an existing cell, click the icon on the cell and then Configure.
- To create a new cell, click Add Cell.
Use the Query Builder or the Script Editor to enter your query. To determine the location of points on a geographic map, query results must include the following fields:
- lat: latitude in decimal degrees (WGS 84)
- lon: longitude in decimal degrees (WGS 84)
Or the
s2_cell_idtag (S2 Cell ID as a token)If query results include
latandlonfields and ans2_cell_idtag, the map uses thelatandlonfields to determine point locations. If results only include thes2_cell_id, the map uses the center of the S2 cell as the point location.See Example queries.
Example queries
View a bird’s migration path
The following query uses the Bird migration sample data to display the migration path of a specific bird.
from(bucket: "migration")
    |> range(start: v.timeRangeStart, stop: v.timeRangeStop)
    |> filter(fn: (r) => r._measurement == "migration")
    |> filter(fn: (r) => r._field == "lat" or r._field == "lon")
    |> filter(fn: (r) => r.id == "91864A")
    |> aggregateWindow(every: v.windowPeriod, fn: last)
View earthquakes reported by USGS
The following query uses the United States Geological Survey (USGS) earthquake data to display the locations of earthquakes.
from(bucket: "usgs")
    |> range(start: v.timeRangeStart, stop: v.timeRangeStop)
    |> filter(fn: (r) => r._measurement == "earthquakes")
    |> filter(fn: (r) => r._field == "lat" or r._field == "lon")
Was this page helpful?
Thank you for your feedback!
Support and feedback
Thank you for being part of our community! We welcome and encourage your feedback and bug reports for InfluxDB and this documentation. To find support, use the following resources:
Customers with an annual or support contract can contact InfluxData Support.