Create histograms with Flux
Histograms provide valuable insight into the distribution of your data.
This guide walks through using Flux’s histogram() function to transform your data into a cumulative histogram.
If you’re just getting started with Flux queries, check out the following:
- Get started with Flux for a conceptual overview of Flux and parts of a Flux query.
- Execute queries to discover a variety of ways to run your queries.
histogram() function
The histogram() function approximates the
cumulative distribution of a dataset by counting data frequencies for a list of “bins.”
A bin is simply a range in which a data point falls.
All data points that are less than or equal to the bound are counted in the bin.
In the histogram output, a column is added (le) that represents the upper bounds of of each bin.
Bin counts are cumulative.
from(bucket: "example-bucket")
    |> range(start: -5m)
    |> filter(fn: (r) => r._measurement == "mem" and r._field == "used_percent")
    |> histogram(bins: [0.0, 10.0, 20.0, 30.0])
Values output by the histogram function represent points of data aggregated over time.
Since values do not represent single points in time, there is no _time column in the output table.
Bin helper functions
Flux provides two helper functions for generating histogram bins.
Each generates an array of floats designed to be used in the histogram() function’s bins parameter.
linearBins()
The linearBins() function generates a list of linearly separated floats.
linearBins(start: 0.0, width: 10.0, count: 10)

// Generated list: [0, 10, 20, 30, 40, 50, 60, 70, 80, 90, +Inf]
logarithmicBins()
The logarithmicBins() function generates a list of exponentially separated floats.
logarithmicBins(start: 1.0, factor: 2.0, count: 10, infinity: true)

// Generated list: [1, 2, 4, 8, 16, 32, 64, 128, 256, 512, +Inf]
Histogram visualization
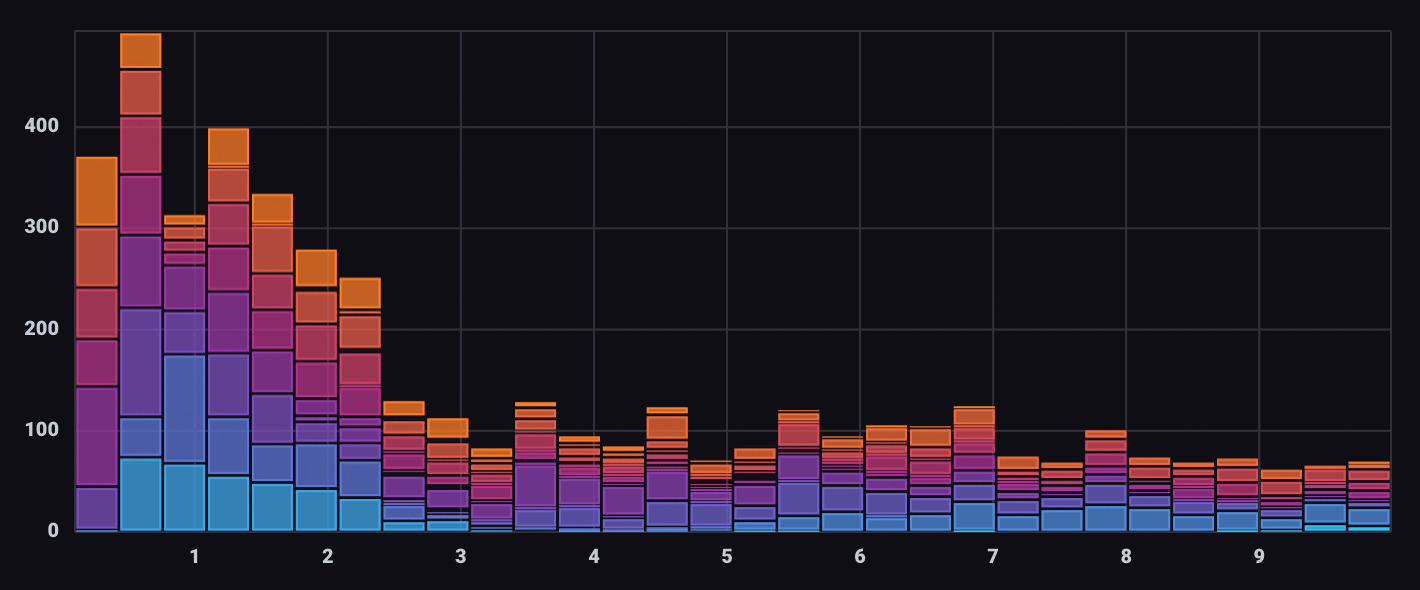
The Histogram visualization type automatically converts query results into a binned and segmented histogram.

Use the Histogram visualization controls to specify the number of bins and define groups in bins.
Histogram visualization data structure
Because the Histogram visualization uses visualization controls to creates bins and groups, do not structure query results as histogram data.
Output of the histogram() function is not compatible
with the Histogram visualization type.
View the example below.
Examples
Generate a histogram with linear bins
from(bucket: "example-bucket")
    |> range(start: -5m)
    |> filter(fn: (r) => r._measurement == "mem" and r._field == "used_percent")
    |> histogram(bins: linearBins(start: 65.5, width: 0.5, count: 20, infinity: false))
Output table
Table: keys: [_start, _stop, _field, _measurement, host]
                   _start:time                      _stop:time           _field:string     _measurement:string               host:string                      le:float                  _value:float
------------------------------  ------------------------------  ----------------------  ----------------------  ------------------------  ----------------------------  ----------------------------
2018-11-07T22:19:58.423358000Z  2018-11-07T22:24:58.423358000Z            used_percent                     mem  Scotts-MacBook-Pro.local                          65.5                             5
2018-11-07T22:19:58.423358000Z  2018-11-07T22:24:58.423358000Z            used_percent                     mem  Scotts-MacBook-Pro.local                            66                             6
2018-11-07T22:19:58.423358000Z  2018-11-07T22:24:58.423358000Z            used_percent                     mem  Scotts-MacBook-Pro.local                          66.5                             8
2018-11-07T22:19:58.423358000Z  2018-11-07T22:24:58.423358000Z            used_percent                     mem  Scotts-MacBook-Pro.local                            67                             9
2018-11-07T22:19:58.423358000Z  2018-11-07T22:24:58.423358000Z            used_percent                     mem  Scotts-MacBook-Pro.local                          67.5                             9
2018-11-07T22:19:58.423358000Z  2018-11-07T22:24:58.423358000Z            used_percent                     mem  Scotts-MacBook-Pro.local                            68                            10
2018-11-07T22:19:58.423358000Z  2018-11-07T22:24:58.423358000Z            used_percent                     mem  Scotts-MacBook-Pro.local                          68.5                            12
2018-11-07T22:19:58.423358000Z  2018-11-07T22:24:58.423358000Z            used_percent                     mem  Scotts-MacBook-Pro.local                            69                            12
2018-11-07T22:19:58.423358000Z  2018-11-07T22:24:58.423358000Z            used_percent                     mem  Scotts-MacBook-Pro.local                          69.5                            15
2018-11-07T22:19:58.423358000Z  2018-11-07T22:24:58.423358000Z            used_percent                     mem  Scotts-MacBook-Pro.local                            70                            23
2018-11-07T22:19:58.423358000Z  2018-11-07T22:24:58.423358000Z            used_percent                     mem  Scotts-MacBook-Pro.local                          70.5                            30
2018-11-07T22:19:58.423358000Z  2018-11-07T22:24:58.423358000Z            used_percent                     mem  Scotts-MacBook-Pro.local                            71                            30
2018-11-07T22:19:58.423358000Z  2018-11-07T22:24:58.423358000Z            used_percent                     mem  Scotts-MacBook-Pro.local                          71.5                            30
2018-11-07T22:19:58.423358000Z  2018-11-07T22:24:58.423358000Z            used_percent                     mem  Scotts-MacBook-Pro.local                            72                            30
2018-11-07T22:19:58.423358000Z  2018-11-07T22:24:58.423358000Z            used_percent                     mem  Scotts-MacBook-Pro.local                          72.5                            30
2018-11-07T22:19:58.423358000Z  2018-11-07T22:24:58.423358000Z            used_percent                     mem  Scotts-MacBook-Pro.local                            73                            30
2018-11-07T22:19:58.423358000Z  2018-11-07T22:24:58.423358000Z            used_percent                     mem  Scotts-MacBook-Pro.local                          73.5                            30
2018-11-07T22:19:58.423358000Z  2018-11-07T22:24:58.423358000Z            used_percent                     mem  Scotts-MacBook-Pro.local                            74                            30
2018-11-07T22:19:58.423358000Z  2018-11-07T22:24:58.423358000Z            used_percent                     mem  Scotts-MacBook-Pro.local                          74.5                            30
2018-11-07T22:19:58.423358000Z  2018-11-07T22:24:58.423358000Z            used_percent                     mem  Scotts-MacBook-Pro.local                            75                            30
Generate a histogram with logarithmic bins
from(bucket: "example-bucket")
    |> range(start: -5m)
    |> filter(fn: (r) => r._measurement == "mem" and r._field == "used_percent")
    |> histogram(bins: logarithmicBins(start: 0.5, factor: 2.0, count: 10, infinity: false))
Output table
Table: keys: [_start, _stop, _field, _measurement, host]
                   _start:time                      _stop:time           _field:string     _measurement:string               host:string                      le:float                  _value:float
------------------------------  ------------------------------  ----------------------  ----------------------  ------------------------  ----------------------------  ----------------------------
2018-11-07T22:23:36.860664000Z  2018-11-07T22:28:36.860664000Z            used_percent                     mem  Scotts-MacBook-Pro.local                           0.5                             0
2018-11-07T22:23:36.860664000Z  2018-11-07T22:28:36.860664000Z            used_percent                     mem  Scotts-MacBook-Pro.local                             1                             0
2018-11-07T22:23:36.860664000Z  2018-11-07T22:28:36.860664000Z            used_percent                     mem  Scotts-MacBook-Pro.local                             2                             0
2018-11-07T22:23:36.860664000Z  2018-11-07T22:28:36.860664000Z            used_percent                     mem  Scotts-MacBook-Pro.local                             4                             0
2018-11-07T22:23:36.860664000Z  2018-11-07T22:28:36.860664000Z            used_percent                     mem  Scotts-MacBook-Pro.local                             8                             0
2018-11-07T22:23:36.860664000Z  2018-11-07T22:28:36.860664000Z            used_percent                     mem  Scotts-MacBook-Pro.local                            16                             0
2018-11-07T22:23:36.860664000Z  2018-11-07T22:28:36.860664000Z            used_percent                     mem  Scotts-MacBook-Pro.local                            32                             0
2018-11-07T22:23:36.860664000Z  2018-11-07T22:28:36.860664000Z            used_percent                     mem  Scotts-MacBook-Pro.local                            64                             2
2018-11-07T22:23:36.860664000Z  2018-11-07T22:28:36.860664000Z            used_percent                     mem  Scotts-MacBook-Pro.local                           128                            30
2018-11-07T22:23:36.860664000Z  2018-11-07T22:28:36.860664000Z            used_percent                     mem  Scotts-MacBook-Pro.local                           256                            30
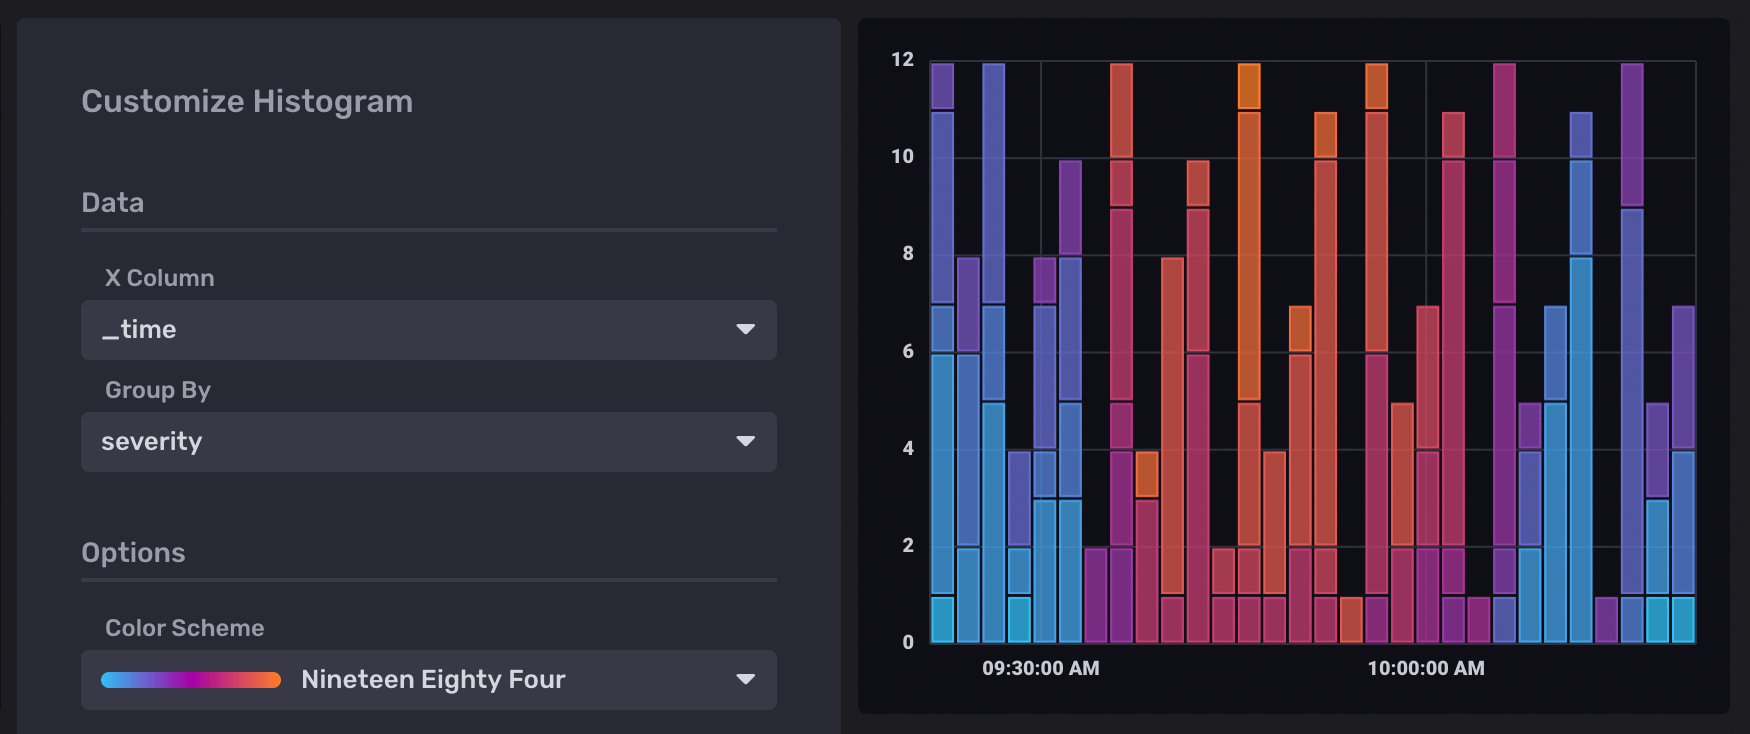
Visualize errors by severity
Use the Telegraf Syslog plugin
to collect error information from your system.
Query the severity_code field in the syslog measurement:
from(bucket: "example-bucket")
    |> range(start: v.timeRangeStart, stop: v.timeRangeStop)
    |> filter(fn: (r) => r._measurement == "syslog" and r._field == "severity_code")
In the Histogram visualization options, select _time as the X Column
and severity as the Group By option:

Use Prometheus histograms in Flux
For information about working with Prometheus histograms in Flux, see Work with Prometheus histograms.
Was this page helpful?
Thank you for your feedback!
Support and feedback
Thank you for being part of our community! We welcome and encourage your feedback and bug reports for InfluxDB and this documentation. To find support, use the following resources:
Customers with an annual or support contract can contact InfluxData Support.
