
Control a dashboard
This page documents an earlier version of InfluxDB OSS. InfluxDB 3 Core is the latest stable version.
API token hashing is enabled by default in InfluxDB OSS 2.9.0
Stronger token security: tokens are stored as hashes on disk, so a copy of the database file doesn’t expose usable tokens. Existing tokens are hashed on first startup and the original strings can’t be recovered afterward — capture any plaintext tokens you still need before you upgrade.
For more information, see Token hashing.
Control at the dashboard level
Use dashboard controls in the upper left to update your dashboard.
Add a cell
Click Add Cell to open the Data Explorer and configure a new cell for your dashboard.
For details on using the Data Explorer, see Explore metrics.
Add a note
- Click Add Note to add a note cell to your dashboard.
- Enter your note in Markdown in the left pane. A preview appears in the right pane.
- Enable the Show note when query returns no data option to show the note only when the query displays no data.
- Click Save.
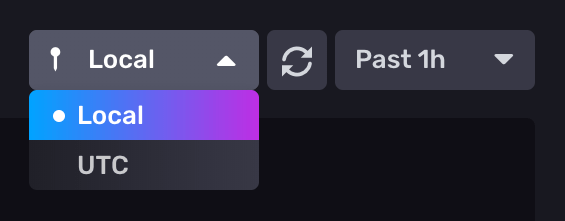
Select timezone
Click the timezone dropdown to select a timezone to use for the dashboard. Select either the local time (default) or UTC.
Manually refresh dashboard
Click the refresh button () to manually refresh the dashboard’s data.
Manually refresh a single dashboard cell
- Click the on the dashboard cell you want to refresh.
- Click Refresh.
Select time range
Select from the time range options in the dropdown menu.

Select Custom Time Range to enter a custom time range with precision up to nanoseconds. The default time range is 5 minutes.
The custom time range uses the selected timezone (local time or UTC).
Add variables
Click Variables to display variables available for your dashboard. For details, see Use and manage variables
Presentation mode
Click the fullscreen icon () to enter presentation mode. Presentation mode allows you to view [a dashboard] in full screen, hiding the left and top navigation menus so only the cells appear. This mode might be helpful, for example, for stationary screens dedicated to monitoring visualizations.
Toggle dark mode and light mode
Click the moon or sun icons to toggle your dashboard between dark mode and light mode.

Was this page helpful?
Thank you for your feedback!
Support and feedback
Thank you for being part of our community! We welcome and encourage your feedback and bug reports for InfluxDB OSS v2 and this documentation. To find support, use the following resources:
Customers with an annual or support contract can contact InfluxData Support.