
Table visualization
This page documents an earlier version of InfluxDB OSS. InfluxDB 3 Core is the latest stable version.
API token hashing is enabled by default in InfluxDB OSS 2.9.0
Stronger token security: tokens are stored as hashes on disk, so a copy of the database file doesn’t expose usable tokens. Existing tokens are hashed on first startup and the original strings can’t be recovered afterward — capture any plaintext tokens you still need before you upgrade.
For more information, see Token hashing.
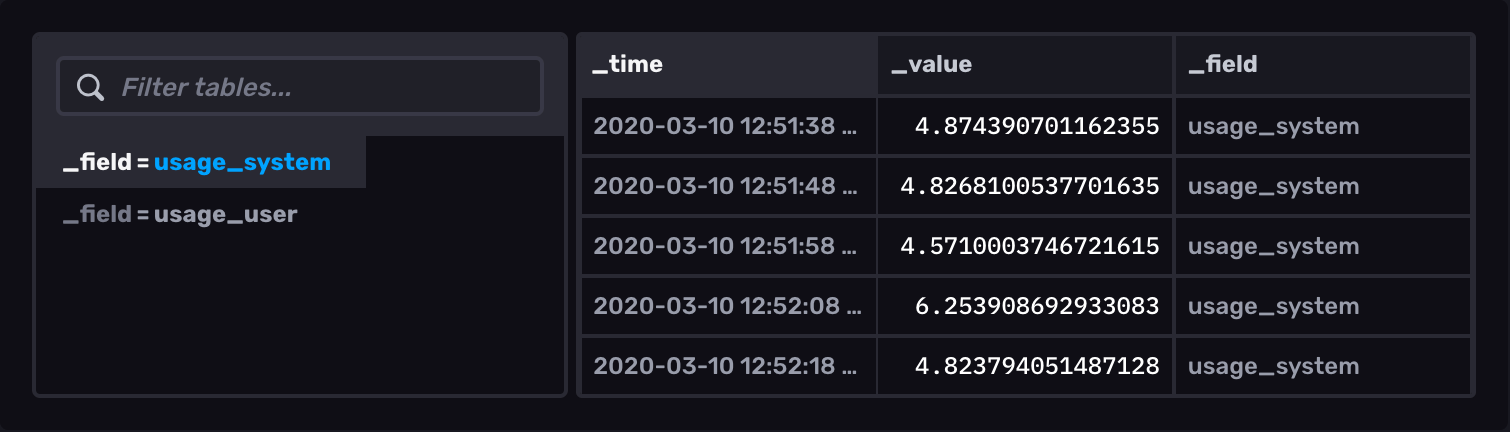
The Table option displays the results of queries in a tabular view, which is sometimes easier to analyze than graph views of data.
Select the Table option from the visualization dropdown in the upper left.
Table behavior
The table visualization renders queried data in structured, easy-to-read tables. Columns and rows match those in the query output. If query results contain multiple tables, only one table is shown at a time. Select other output tables in the far left column of the table visualization. Tables are identified by their group key.
Table Controls
To view Table controls, click Customize next to the visualization dropdown.
Formatting
Default Sort Field: Select the default sort field. Default is time.
Time Format: Select the time format. Options include:
- YYYY-MM-DD HH:mm:ss ZZ
- YYYY-MM-DD hh:mm:ss a ZZ
- DD/MM/YYYY HH:mm:ss.sss
- DD/MM/YYYY hh:mm:ss.sss a
- MM/DD/YYYY HH:mm:ss.sss
- MM/DD/YYYY hh:mm:ss.sss a
- YYYY/MM/DD HH:mm:ss
- YYYY/MM/DD hh:mm:ss a
- HH:mm
- hh:mm a
- HH:mm:ss
- hh:mm:ss a
- HH:mm:ss ZZ
- hh:mm:ss a ZZ
- HH:mm:ss.sss
- hh:mm:ss.sss a
- MMMM D, YYYY HH:mm:ss
- MMMM D, YYYY hh:mm:ss a
- dddd, MMMM D, YYYY HH:mm:ss
- dddd, MMMM D, YYYY hh:mm:ss a
Decimal Places: Enter the number of decimal places. Default (empty field) is unlimited.
- Auto or Custom: Enable or disable auto-setting.
Colorized Thresholds
- Base Color: Select a base or background color from the selection list.
- Add a Threshold: Change the color of the table based on the current value.
- Value is: Enter the value at which the table should appear in the selected color. Choose a color from the dropdown menu next to the value.
Column Settings
- First Column: Toggle to Fixed to lock the first column so that the listings are always visible. Threshold settings do not apply in the first column when locked.
- Table Columns:
- Enter a new name to rename any of the columns.
- Click the eye icon next to a column to hide it.
- [additional]: Enter name for each additional column.
- Change the order of the columns by dragging to the desired position.
Table examples
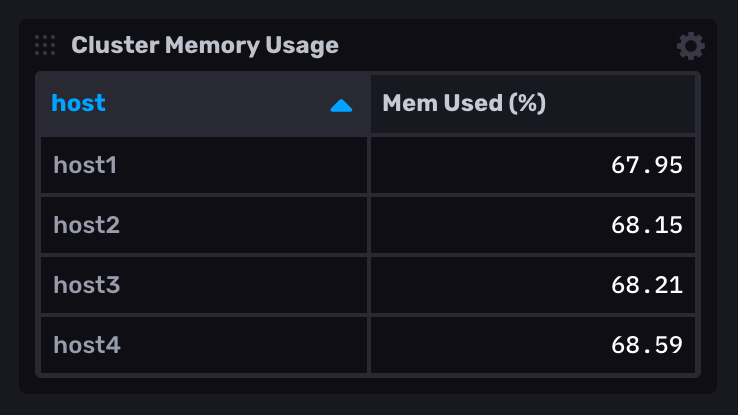
Tables are helpful when displaying many human-readable metrics in a dashboard such as cluster statistics or log messages.
Human-readable cluster metrics
The following example queries the latest reported memory usage from a cluster of servers.
Query the latest memory usage from each host
from(bucket: "example-bucket")
    |> range(start: v.timeRangeStart, stop: v.timeRangeStop)
    |> filter(fn: (r) => r._measurement == "mem" and r._field == "used_percent")
    |> group(columns: ["host"])
    |> last()
    |> group()
    |> keep(columns: ["_value", "host"])
Cluster metrics in a table
Was this page helpful?
Thank you for your feedback!
Support and feedback
Thank you for being part of our community! We welcome and encourage your feedback and bug reports for InfluxDB OSS v2 and this documentation. To find support, use the following resources:
Customers with an annual or support contract can contact InfluxData Support.