
Graph visualization
This page documents an earlier version of InfluxDB OSS. InfluxDB 3 Core is the latest stable version.
API token hashing is enabled by default in InfluxDB OSS 2.9.0
Stronger token security: tokens are stored as hashes on disk, so a copy of the database file doesn’t expose usable tokens. Existing tokens are hashed on first startup and the original strings can’t be recovered afterward — capture any plaintext tokens you still need before you upgrade.
For more information, see Token hashing.
The Graph visualization provides several types of graphs, each configured through the Graph controls.
Select the Graph option from the visualization dropdown in the upper left.
Graph behavior
The Graph visualization color codes each table (or series) in the queried data set. When multiple series are present, it automatically assigns colors based on the selected Line Colors option.
When using a line graph, all points within a single table are connected. When multiple series are present, it automatically assigns colors based on the selected Line Colors option.
Graph controls
To view Graph controls, click Customize next to the visualization dropdown.
Data
- X Column: Select a column to display on the x-axis.
- Y Column: Select a column to display on the y-axis.
Options
- Time Format: Select the time format. Options include:
- YYYY-MM-DD HH:mm:ss ZZ
- YYYY-MM-DD hh:mm:ss a ZZ
- DD/MM/YYYY HH:mm:ss.sss
- DD/MM/YYYY hh:mm:ss.sss a
- MM/DD/YYYY HH:mm:ss.sss
- MM/DD/YYYY hh:mm:ss.sss a
- YYYY/MM/DD HH:mm:ss
- YYYY/MM/DD hh:mm:ss a
- HH:mm
- hh:mm a
- HH:mm:ss
- hh:mm:ss a
- HH:mm:ss ZZ
- hh:mm:ss a ZZ
- HH:mm:ss.sss
- hh:mm:ss.sss a
- MMMM D, YYYY HH:mm:ss
- MMMM D, YYYY hh:mm:ss a
- dddd, MMMM D, YYYY HH:mm:ss
- dddd, MMMM D, YYYY hh:mm:ss a
- Interpolation: Select from the following options:
- Linear: Display a time series in a line graph
- Smooth: Display a time series in a line graph with smooth point interpolation.
- Step: Display a time series in a staircase graph.
- Line Colors: Select a color scheme to use for your graph.
- Shade Area Below Lines: Shade in the area below the graph lines.
- Hover Dimension: Select the data to display in the tooltip when you hover over the graph:
- auto or X Axis: Show all points with the same x value along the y-axis.
- Y Axis: Show all points with the same y value along the x-axis.
- X & Y Axis: Show only the point currently being hovered over.
X Axis
- Generate X-Axis Tick Marks: Select the method to generate x-axis tick marks:
- Auto: Select to automatically generate tick marks.
- Custom: To customize the number of x-axis tick marks, select this option, and then enter the following:
- Total Tick Marks: Enter the total number of ticks to display.
- Start Tick Marks At: Enter the value to start ticks at.
- Tick Mark Interval: Enter the interval in between each tick.
Y Axis
- Y Axis Label: Label for the y-axis.
- Y-Value Unit Prefix:
- None:
- SI:
- Binary:
- Y Axis Prefix: Prefix to be added to y-value.
- Y Axis Suffix: Suffix to be added to y-value.
- Generate Y-Axis Tick Marks: Select the method to generate y-axis tick marks:
- Auto: Select to automatically generate tick marks.
- Custom: To customize the number of y-axis tick marks, select this option, and then enter the following:
- Total Tick Marks: Enter the total number of ticks to display.
- Start Tick Marks At: Enter the value to start ticks at.
- Tick Mark Interval: Enter the interval in between each tick.
- Y Axis Domain: The y-axis value range.
- Auto: Automatically determine the value range based on values in the data set.
- Custom: Manually specify the minimum y-axis value, maximum y-axis value, or range by including both.
- Min: Minimum y-axis value.
- Max: Maximum y-axis value.
- Positioning:
- Overlaid: Display graph lines overlaid on each other.
- Stacked: Display graph lines stacked on top of each other.
Hover Legend
- Display Hover Legend:
- Hide: Hide the legend that appears upon hover.
- Show: Show the legend upon hover.
- Orientation: Select the orientation of the legend:
- Horizontal: Select to display the legend horizontally.
- Vertical: Select to display the legend vertically.
- Opacity: Adjust the hover legend opacity using the slider.
- Colorize Rows: Select to display hover legend rows in colors.
- Orientation: Select the orientation of the legend:
Static Legend
- Display Static Legend:
- Hide: Hide the static legend.
- Show: Always show the static legend.
- Orientation: Select the orientation of the legend:
- Horizontal: Select to display the legend horizontally.
- Vertical: Select to display the legend vertically.
- Opacity: Adjust the static legend opacity using the slider.
- Colorize Rows: Select to display static legend rows in colors.
- Displayed Value: Select Latest Y Axis or Latest X Axis to determine whether the y or x axis appears on the legend.
- Height: Adjust the height of the static legend using the slider.
- Orientation: Select the orientation of the legend:
Graph Examples
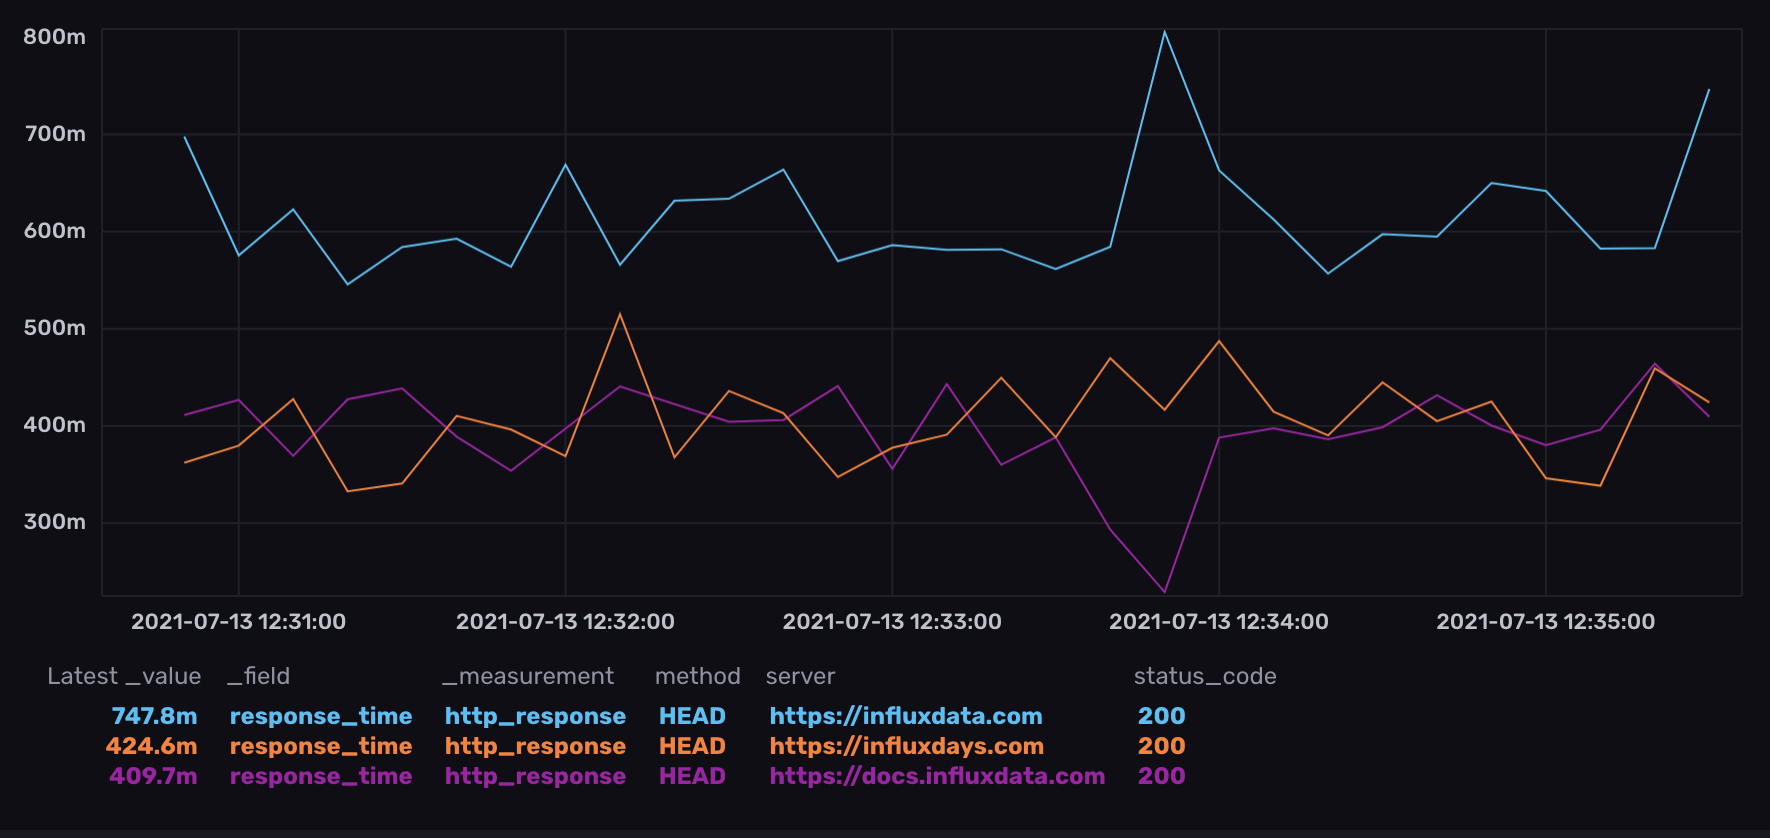
Graph with linear interpolation and static legend
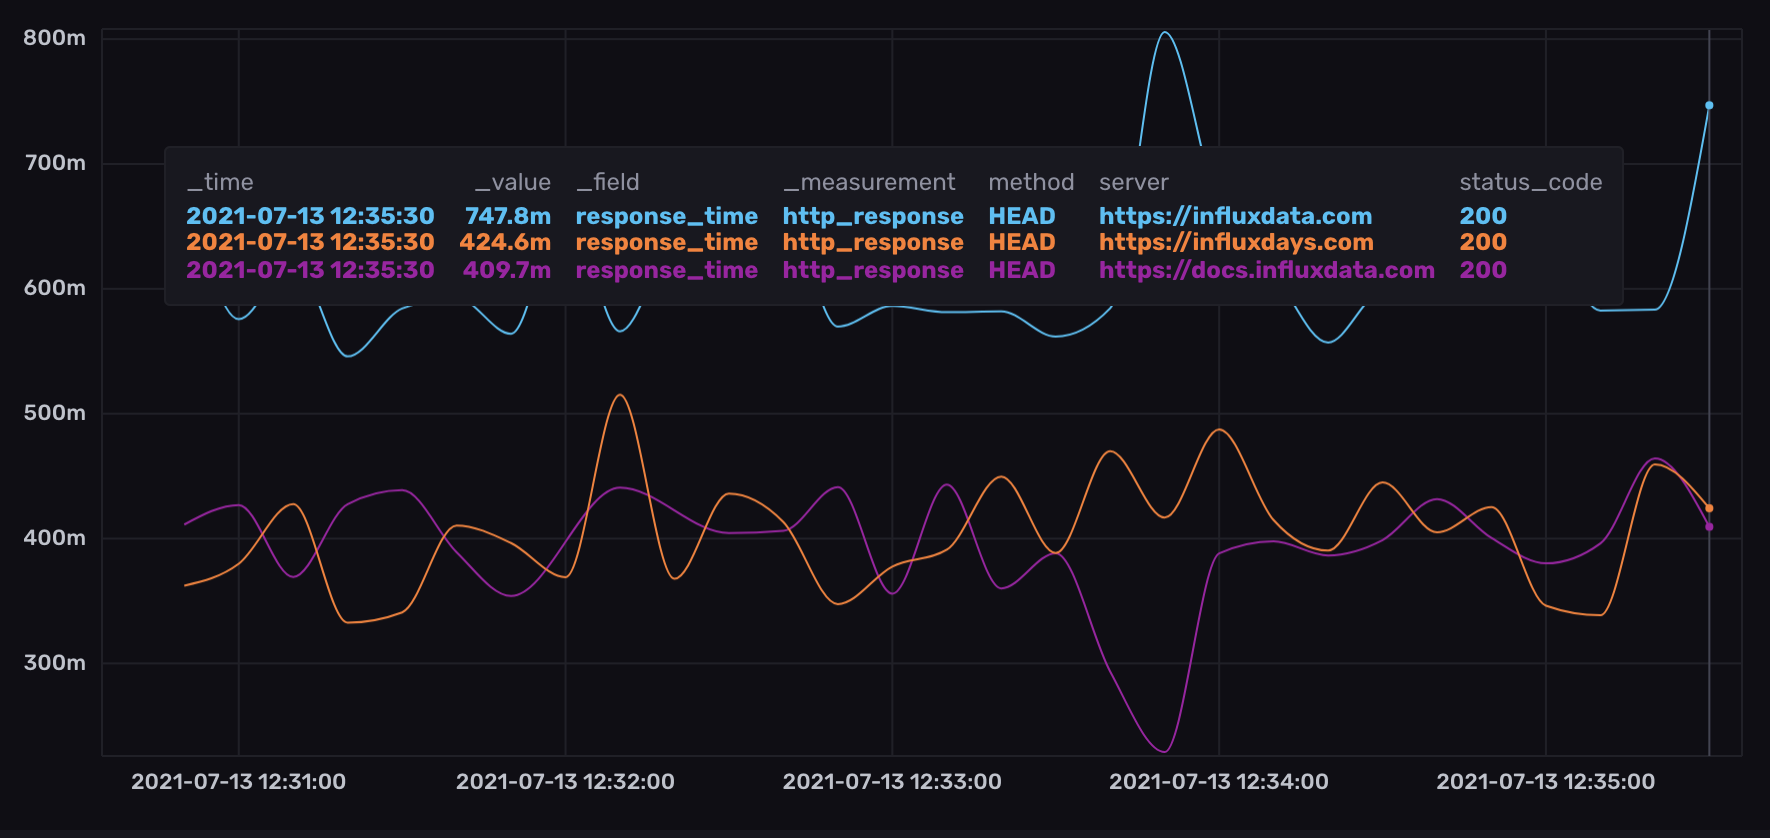
Graph with smooth interpolation and hover legend
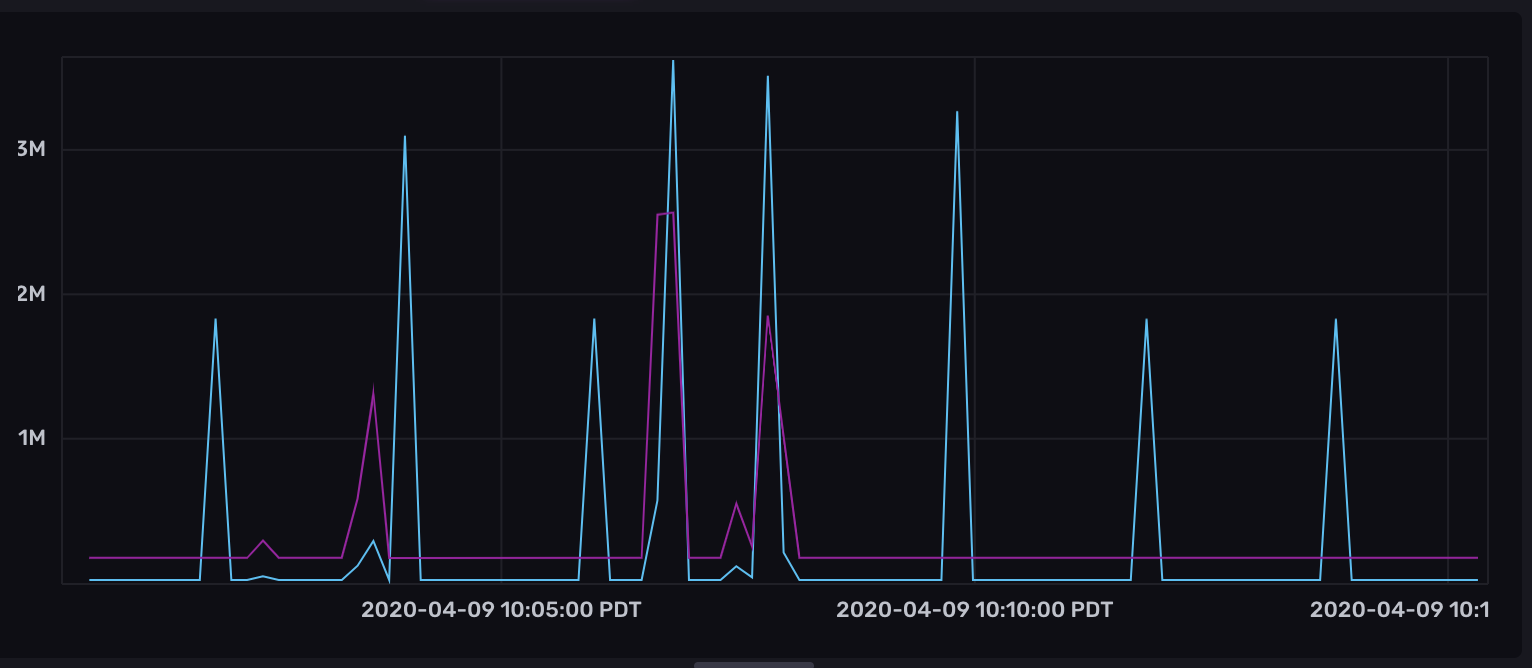
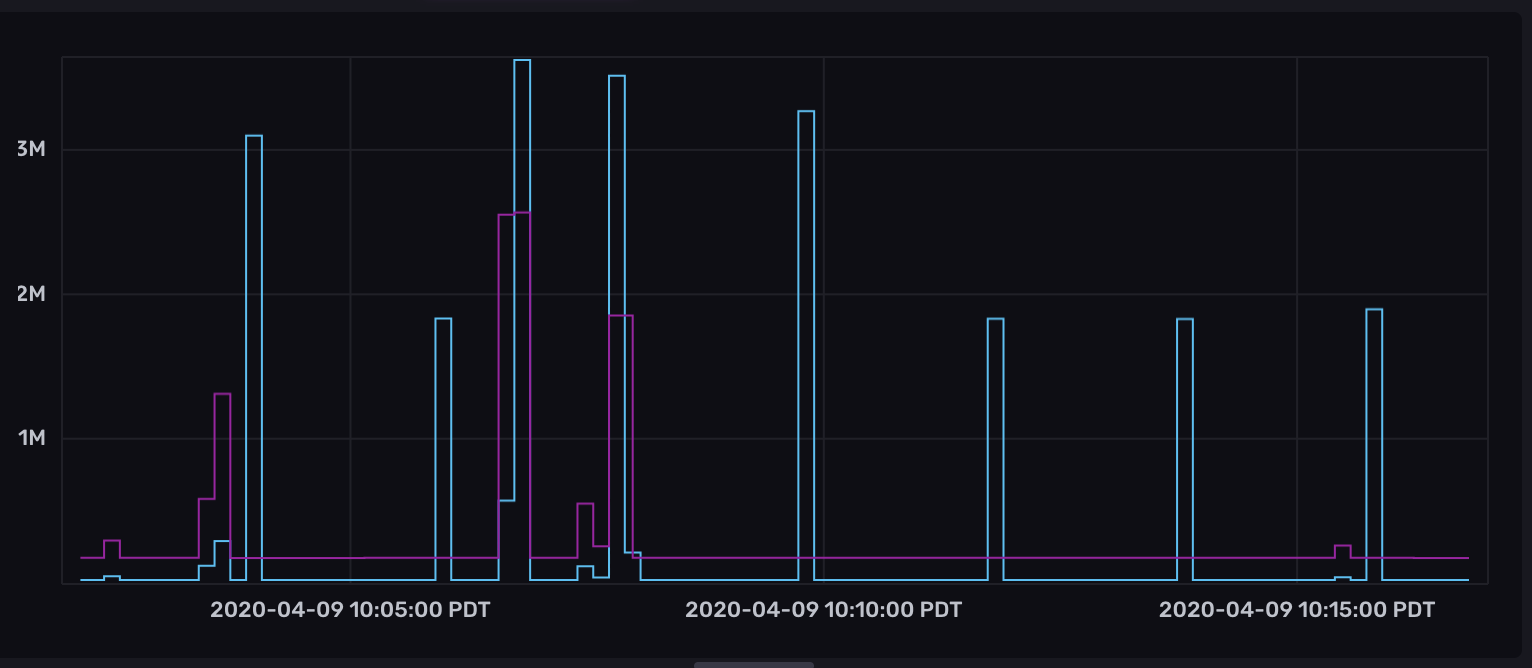
Graph with step interpolation and no visible legend
Was this page helpful?
Thank you for your feedback!
Support and feedback
Thank you for being part of our community! We welcome and encourage your feedback and bug reports for InfluxDB OSS v2 and this documentation. To find support, use the following resources:
Customers with an annual or support contract can contact InfluxData Support.