
Scraping and discovery
Data can be pulled from a dynamic list of remote targets with the discovery and scraping features of Kapacitor. Use those features with TICKscripts to monitor targets, process the data, and write data to InfluxDB. Currently, Kapacitor supports only Prometheus style targets.
Note: Scraping and discovery is currently under technical preview. There may be changes to the configuration and behavior in subsequent releases.
Content
Overview
The diagram below outlines the infrastructure for discovering and scraping data with Kapacitor.
Image 1 – Scrapping and Discovery work flow
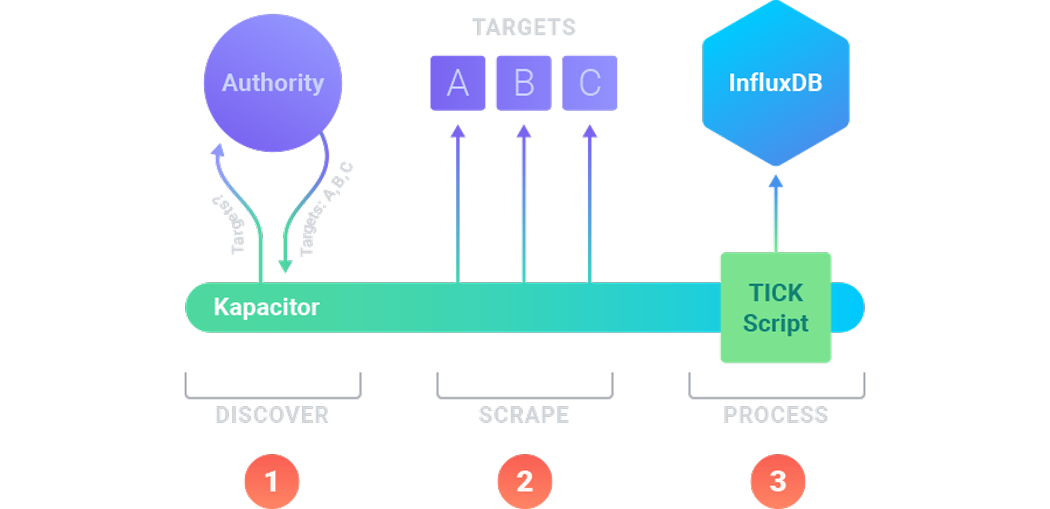
- First, Kapacitor implements the discovery process to identify the available targets in your infrastructure.
It requests that information at regular intervals and receives that information from an authority.
In the diagram, the authority informs Kapacitor of three targets:
A,B, andC. - Next, Kapacitor implements the scraping process to pull metrics data from the existing targets.
It runs the scraping process at regular intervals.
Here, Kapacitor requests metrics from targets
A,B, andC. The application running onA,B, andCexposes a/metricsendpoint on its HTTP API which returns application-specific statistics. - Finally, Kapacitor processes the data according to configured TICKscripts. Use TICKscripts to filter, transform, and perform other tasks on the metrics data. In addition, if the data should be stored, configure a TICKscript to send it to InfluxDB.
Pushing vs. Pulling Metrics
By combining discovery with scraping, Kapacitor enables a metrics gathering infrastructure to pull metrics off of targets instead of requiring them to push metrics out to InfluxDB. Pulling metrics has several advantages in dynamic environments where a target may have a short lifecycle.
Configuring Scrapers and Discoverers
A single scraper scrapes the targets from a single discoverer. Configuring both scrapers and discoverers comes down to configuring each individually and then informing the scraper about the discoverer.
Below are all the configuration options for a scraper.
Example 1 – Scrapper Configuration
[[scraper]]
  enabled = false
  name = "myscraper"
  # ID of the discoverer to use
  discoverer-id = ""
  # The kind of discoverer to use
  discoverer-service = ""
  db = "mydb"
  rp = "myrp"
  type = "prometheus"
  scheme = "http"
  metrics-path = "/metrics"
  scrape-interval = "1m0s"
  scrape-timeout = "10s"
  username = ""
  password = ""
  bearer-token = ""
  ssl-ca = ""
  ssl-cert = ""
  ssl-key = ""
  ssl-server-name = ""
  insecure-skip-verify = false
Available Discoverers
Kapacitor supports the following services for discovery:
| Name | Description |
|---|---|
| azure | Discover targets hosted in Azure. |
| consul | Discover targets using Consul service discovery. |
| dns | Discover targets via DNS queries. |
| ec2 | Discover targets hosted in AWS EC2. |
| file-discovery | Discover targets listed in files. |
| gce | Discover targets hosted in GCE. |
| kubernetes | Discover targets hosted in Kubernetes. |
| marathon | Discover targets using Marathon service discovery. |
| nerve | Discover targets using Nerve service discovery. |
| serverset | Discover targets using Serversets service discovery. |
| static-discovery | Statically list targets. |
| triton | Discover targets using Triton service discovery. |
See the example configuration file for details on configuring each discoverer.
Was this page helpful?
Thank you for your feedback!
Support and feedback
Thank you for being part of our community! We welcome and encourage your feedback and bug reports for Kapacitor and this documentation. To find support, use the following resources: