
Troubleshoot high disk usage
It’s very important that components of your TICK stack do not run out of disk. A machine with 100% disk usage will not function properly.
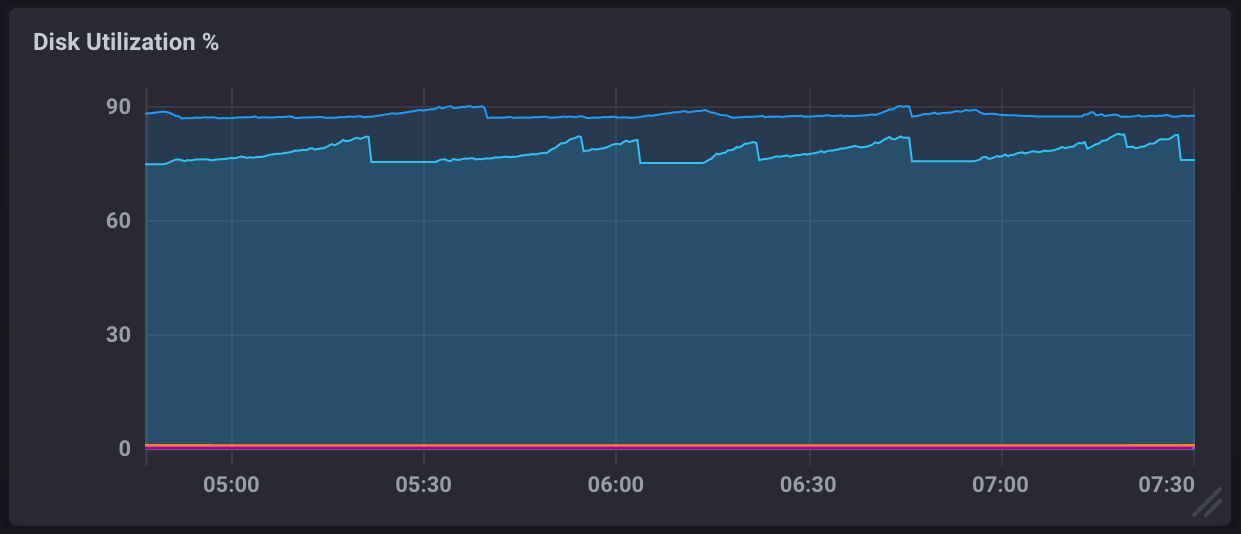
In a monitoring dashboard, high disk usage will appear in the Disk Utilization % metric and look similar to the following:
Potential causes
Old data not being downsampled
InfluxDB uses retention policies and continuous queries to downsample older data and preserve disk space. If using an infinite retention policy or one with a lengthy duration, high resolution data will use more and more disk space.
Log data not being dropped
Log data is incredibly useful in your monitoring solution, but can also require more disk space than other types of time series data. Many times, log data is stored in an infinite retention policy (the default retention policy duration), meaning it never gets dropped. This will inevitably lead to high disk utilization.
Solutions
Remove unnecessary data
The simplest solution to high disk utilization is removing old or unnecessary data. This can be done by brute force (deleting/dropping data) or in a more graceful manner by tuning the duration of your retention policies and adjusting the downsampling rates in your continuous queries.
Log data retention policies
Log data should only be stored in a finite retention policy. The duration of your retention policy is determined by how long you want to keep log data around.
Whether or not you use a continuous query to downsample log data at the end of its retention period is up to you, but old log data should either be downsampled or dropped altogether.
Scale your machine’s disk capacity
If removing or downsampling data isn’t an option, you can always scale your machine’s disk capacity. How this is done depends on your hardware or virtualization configuration and is not covered in this documentation.
Recommendations
Set up a disk usage alert
To preempt disk utilization issues, create a task that alerts you if disk usage crosses certain thresholds. The example TICKscript below sets warning and critical disk usage thresholds and sends a message to Slack whenever those thresholds are crossed.
For information about Kapacitor tasks and alerts, see the Kapacitor alerts documentation.
Example TICKscript alert for disk usage
// Disk usage alerts
// Alert when disks are this % full
var warn_threshold = 80
var crit_threshold = 90

// Use a larger period here, as the telegraf data can be a little late
// if the server is under load.
var period = 10m

// How often to query for the period.
var every = 20m

var data = batch
  |query('''
    SELECT last(used_percent) FROM "telegraf"."default".disk
    WHERE ("path" = '/influxdb/conf' or "path" = '/')
    ''')
    .period(period)
    .every(every)
    .groupBy('host', 'path')

data
  |alert()
    .id('Alert: Disk Usage, Host: {{ index .Tags "host" }}, Path: {{ index .Tags "path" }}')
    .warn(lambda: "last" > warn_threshold)
    .message('{{ .ID }}, Used Percent: {{ index .Fields "last" | printf "%0.0f" }}%')
    .details('')
    .stateChangesOnly()
    .slack()

data
  |alert()
    .id('Alert: Disk Usage, Host: {{ index .Tags "host" }}, Path: {{ index .Tags "path" }}')
    .crit(lambda: "last" > crit_threshold)
    .message('{{ .ID }}, Used Percent: {{ index .Fields "last" | printf "%0.0f" }}%')
    .details('')
    .slack()
Was this page helpful?
Thank you for your feedback!
Support and feedback
Thank you for being part of our community! We welcome and encourage your feedback and bug reports for and this documentation. To find support, use the following resources:
Customers with an annual or support contract can contact InfluxData Support.