
Get cluster information
Use the Admin UI or the influxctl cluster get CLI command to view information about your
InfluxDB Cloud Dedicated cluster, including:
- Cluster ID
- Cluster name
- Cluster URL
- Cluster status
- Cluster size (standard or custom)
Access the InfluxDB Cloud Dedicated Admin UI at console.influxdata.com. If you don’t have login credentials, contact InfluxData support.
View cluster details
The cluster list displays the following cluster details:
- Cluster ID and name
- Status (ready, provisioning, etc.)
- Size (standard or custom)
- URL endpoint
Cluster management tools
The options button (3 vertical dots) to the right of any cluster provides additional tools for cluster management:
- Copy Cluster ID
- Copy Cluster URL
- Observe in Grafana (only if your cluster has enabled operational dashboards. For more information, see how to monitor your cluster.)
View cluster overview and metrics
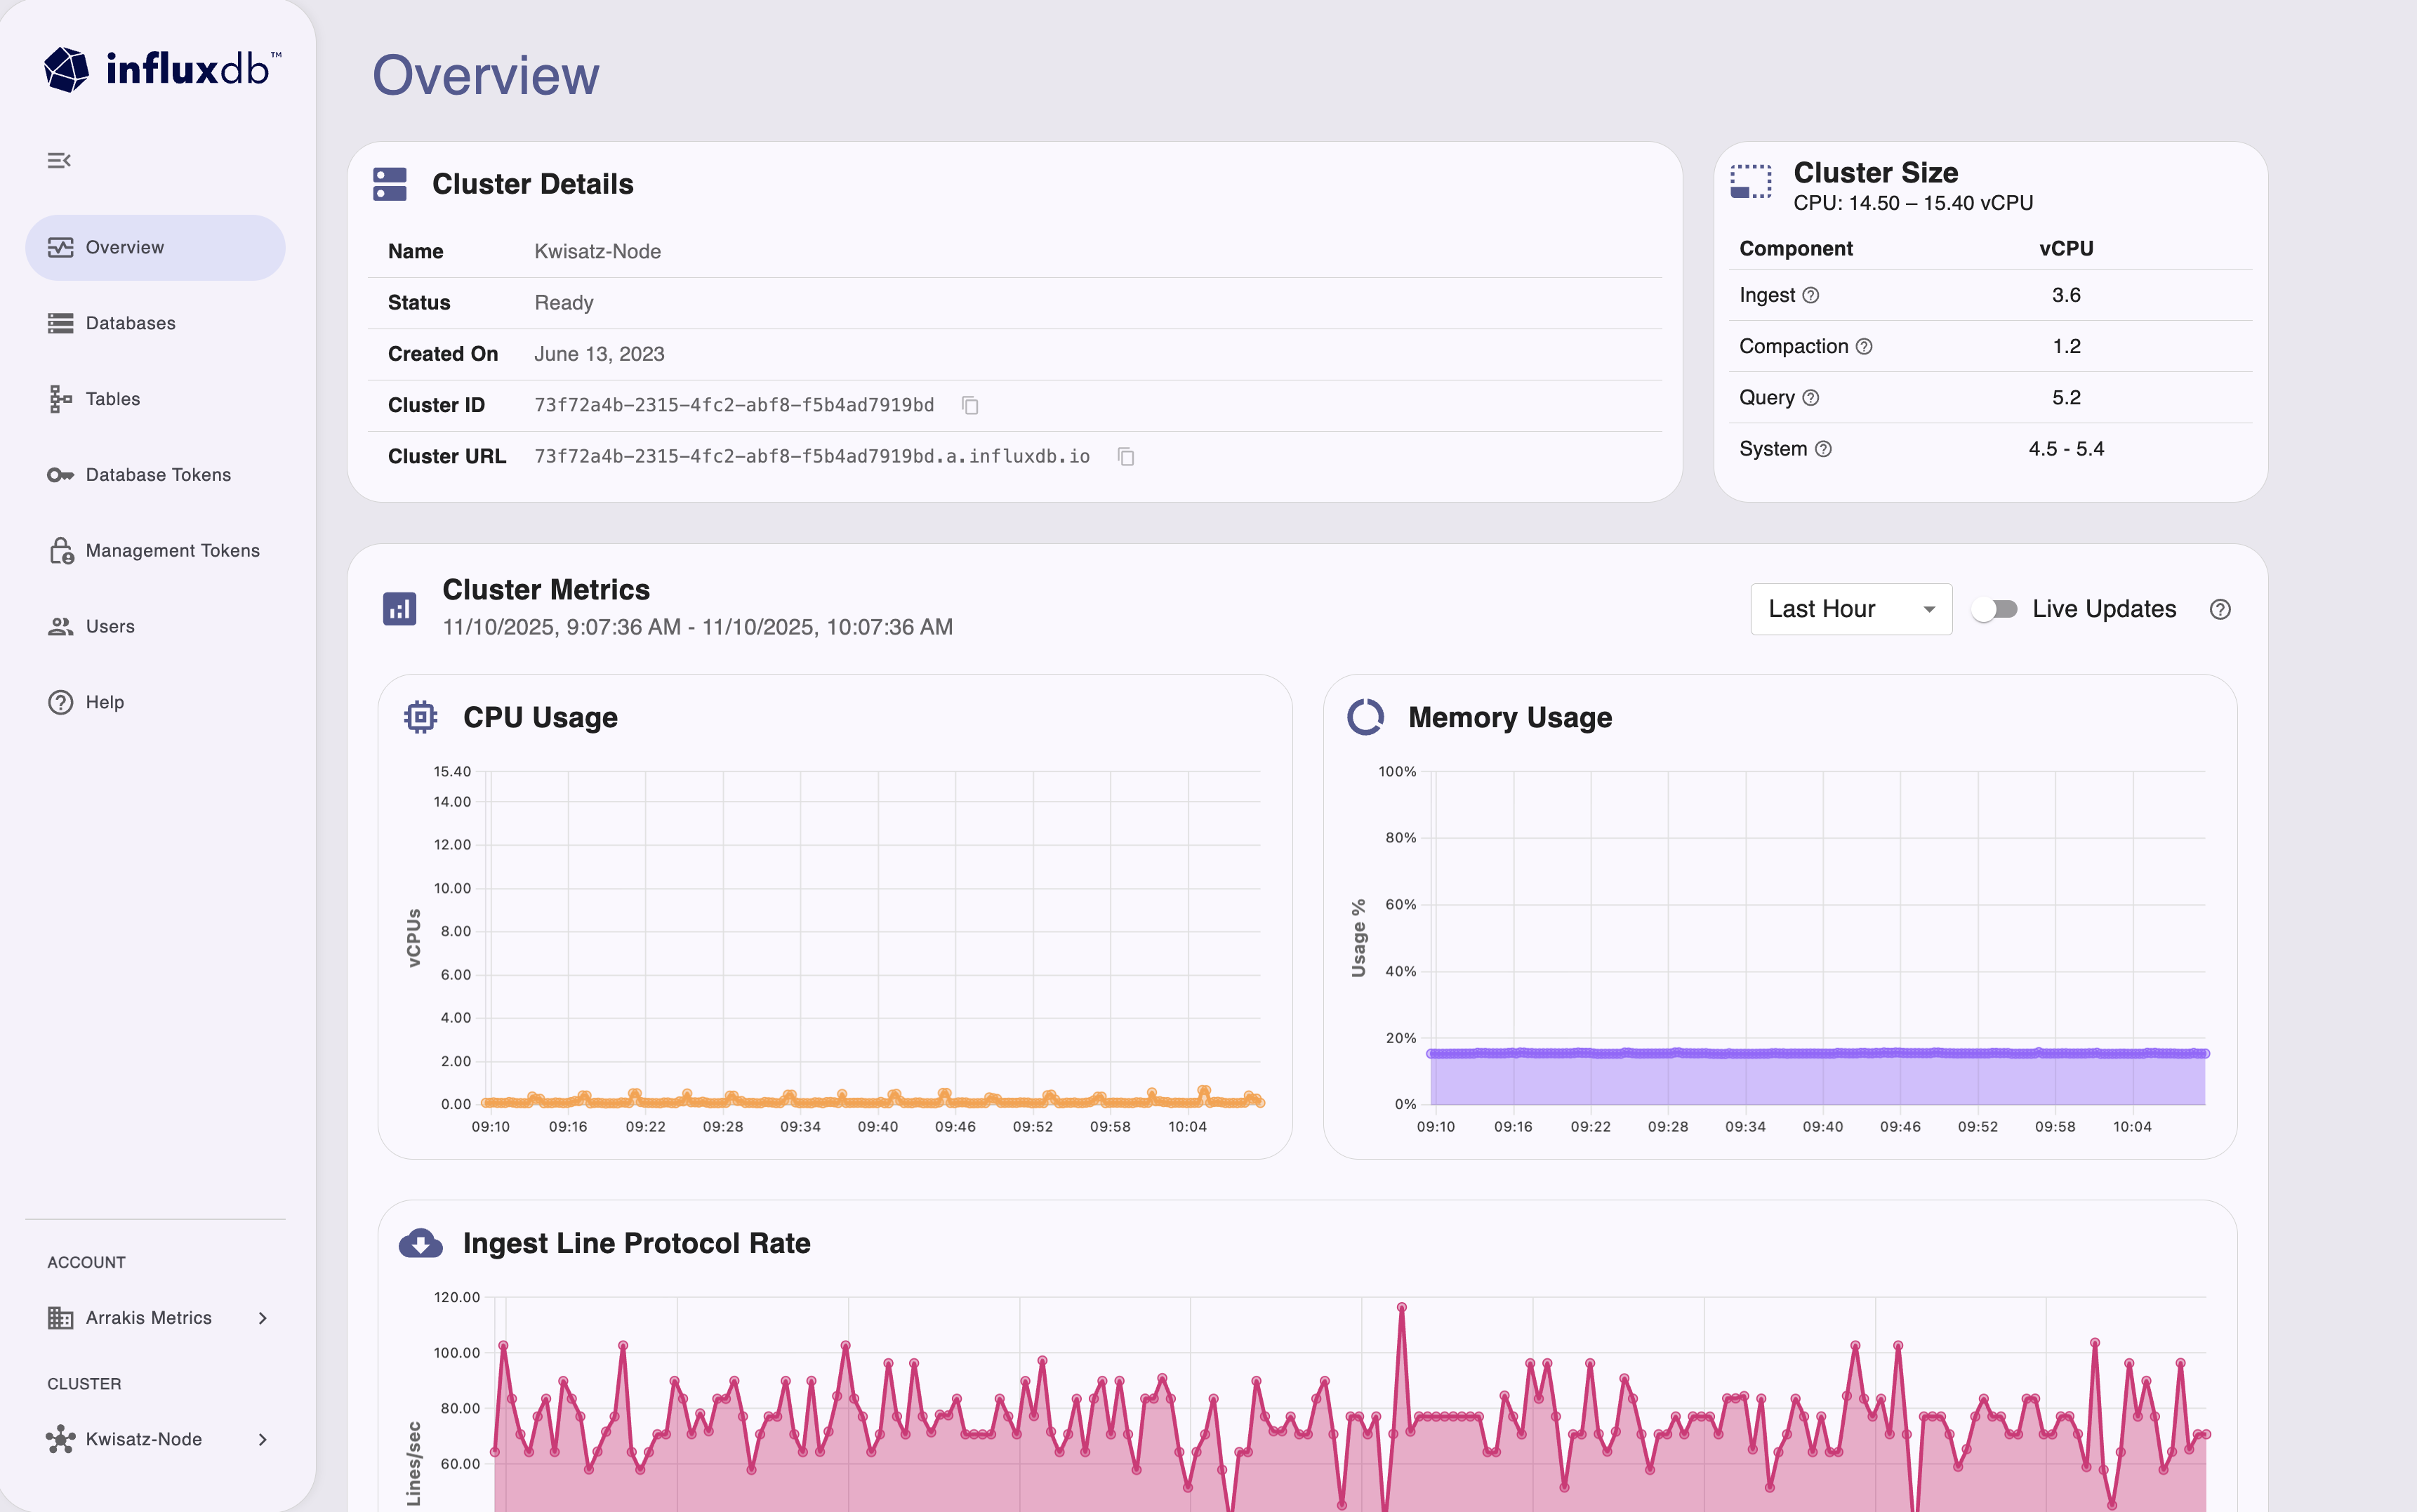
After selecting a cluster, the Overview page displays real-time cluster information and metrics:
- Cluster Details: View cluster name, status, creation date, cluster ID, and cluster URL.
- Cluster Size: See CPU allocation and component vCPU distribution (Ingest, Compaction, Query, System).
- Cluster Metrics: Monitor CPU usage, memory usage, and ingest line protocol rate with time-series charts.
- Configure the metrics time range and enable live updates for real-time monitoring.
If you haven’t already, download and install the
influxctlCLI, and then configure a connection profile for your cluster.Run
influxctl cluster getwith the following:- Cluster ID
- Optional: Output format
influxctl cluster get --format table CLUSTER_IDReplace CLUSTER_ID with the
ID of the cluster you want to view information about.
Output formats
The influxctl cluster get command supports two output formats: table and json.
By default, the output is formatted as a table.
For additional cluster details and easier programmatic access to the command output, include --format json
with your command to format the cluster as a JSON object.
Example output
+-------+----------------------------------------------------+
|    id | X0x0xxx0-0XXx-000x-00x0-0X000Xx00000                |
|  name | Internal - Cluster 1                               |
| state | ready                                              |
|   url | X0x0xxx0-0XXx-000x-00x0-0X000Xx00000.a.influxdb.io  |
+-------+----------------------------------------------------+
Detailed output in JSON
For additional cluster details and easier programmatic access to the command output, include --format json
with your command–for example:
influxctl cluster get --format json X0x0xxx0-0XXx-000x-00x0-0X000Xx00000The output is the cluster as a JSON object that includes additional fields such as account ID and created date.
{
    "account_id": "0x0x0x00-0Xx0-00x0-x0X0-00x00XX0Xx0X",
    "cluster_id": "X0x0xxx0-0XXx-000x-00x0-0X000Xx00000",
    "name": "Internal - Cluster 1",
    "url": "X0x0xxx0-0XXx-000x-00x0-0X000Xx00000.a.influxdb.io",
    "state": "ready",
    "created_at": {
      "seconds": 1686670941,
      "nanos": 520023000
    },
    "category": 1
}
Was this page helpful?
Thank you for your feedback!
Support and feedback
Thank you for being part of our community! We welcome and encourage your feedback and bug reports for InfluxDB Cloud Dedicated and this documentation. To find support, use the following resources:
Customers with an annual or support contract can contact InfluxData Support.