Documentation

View account information

Use the Admin UI for InfluxDB Cloud Dedicated to view information for your Cloud Dedicated account. Your InfluxDB Cloud Dedicated account is a collection of InfluxDB Cloud Dedicated clusters and associated resources.

Access and navigate the Admin UI

Access the InfluxDB Cloud Dedicated Admin UI at console.influxdata.com. If you don’t have login credentials, contact InfluxData support.

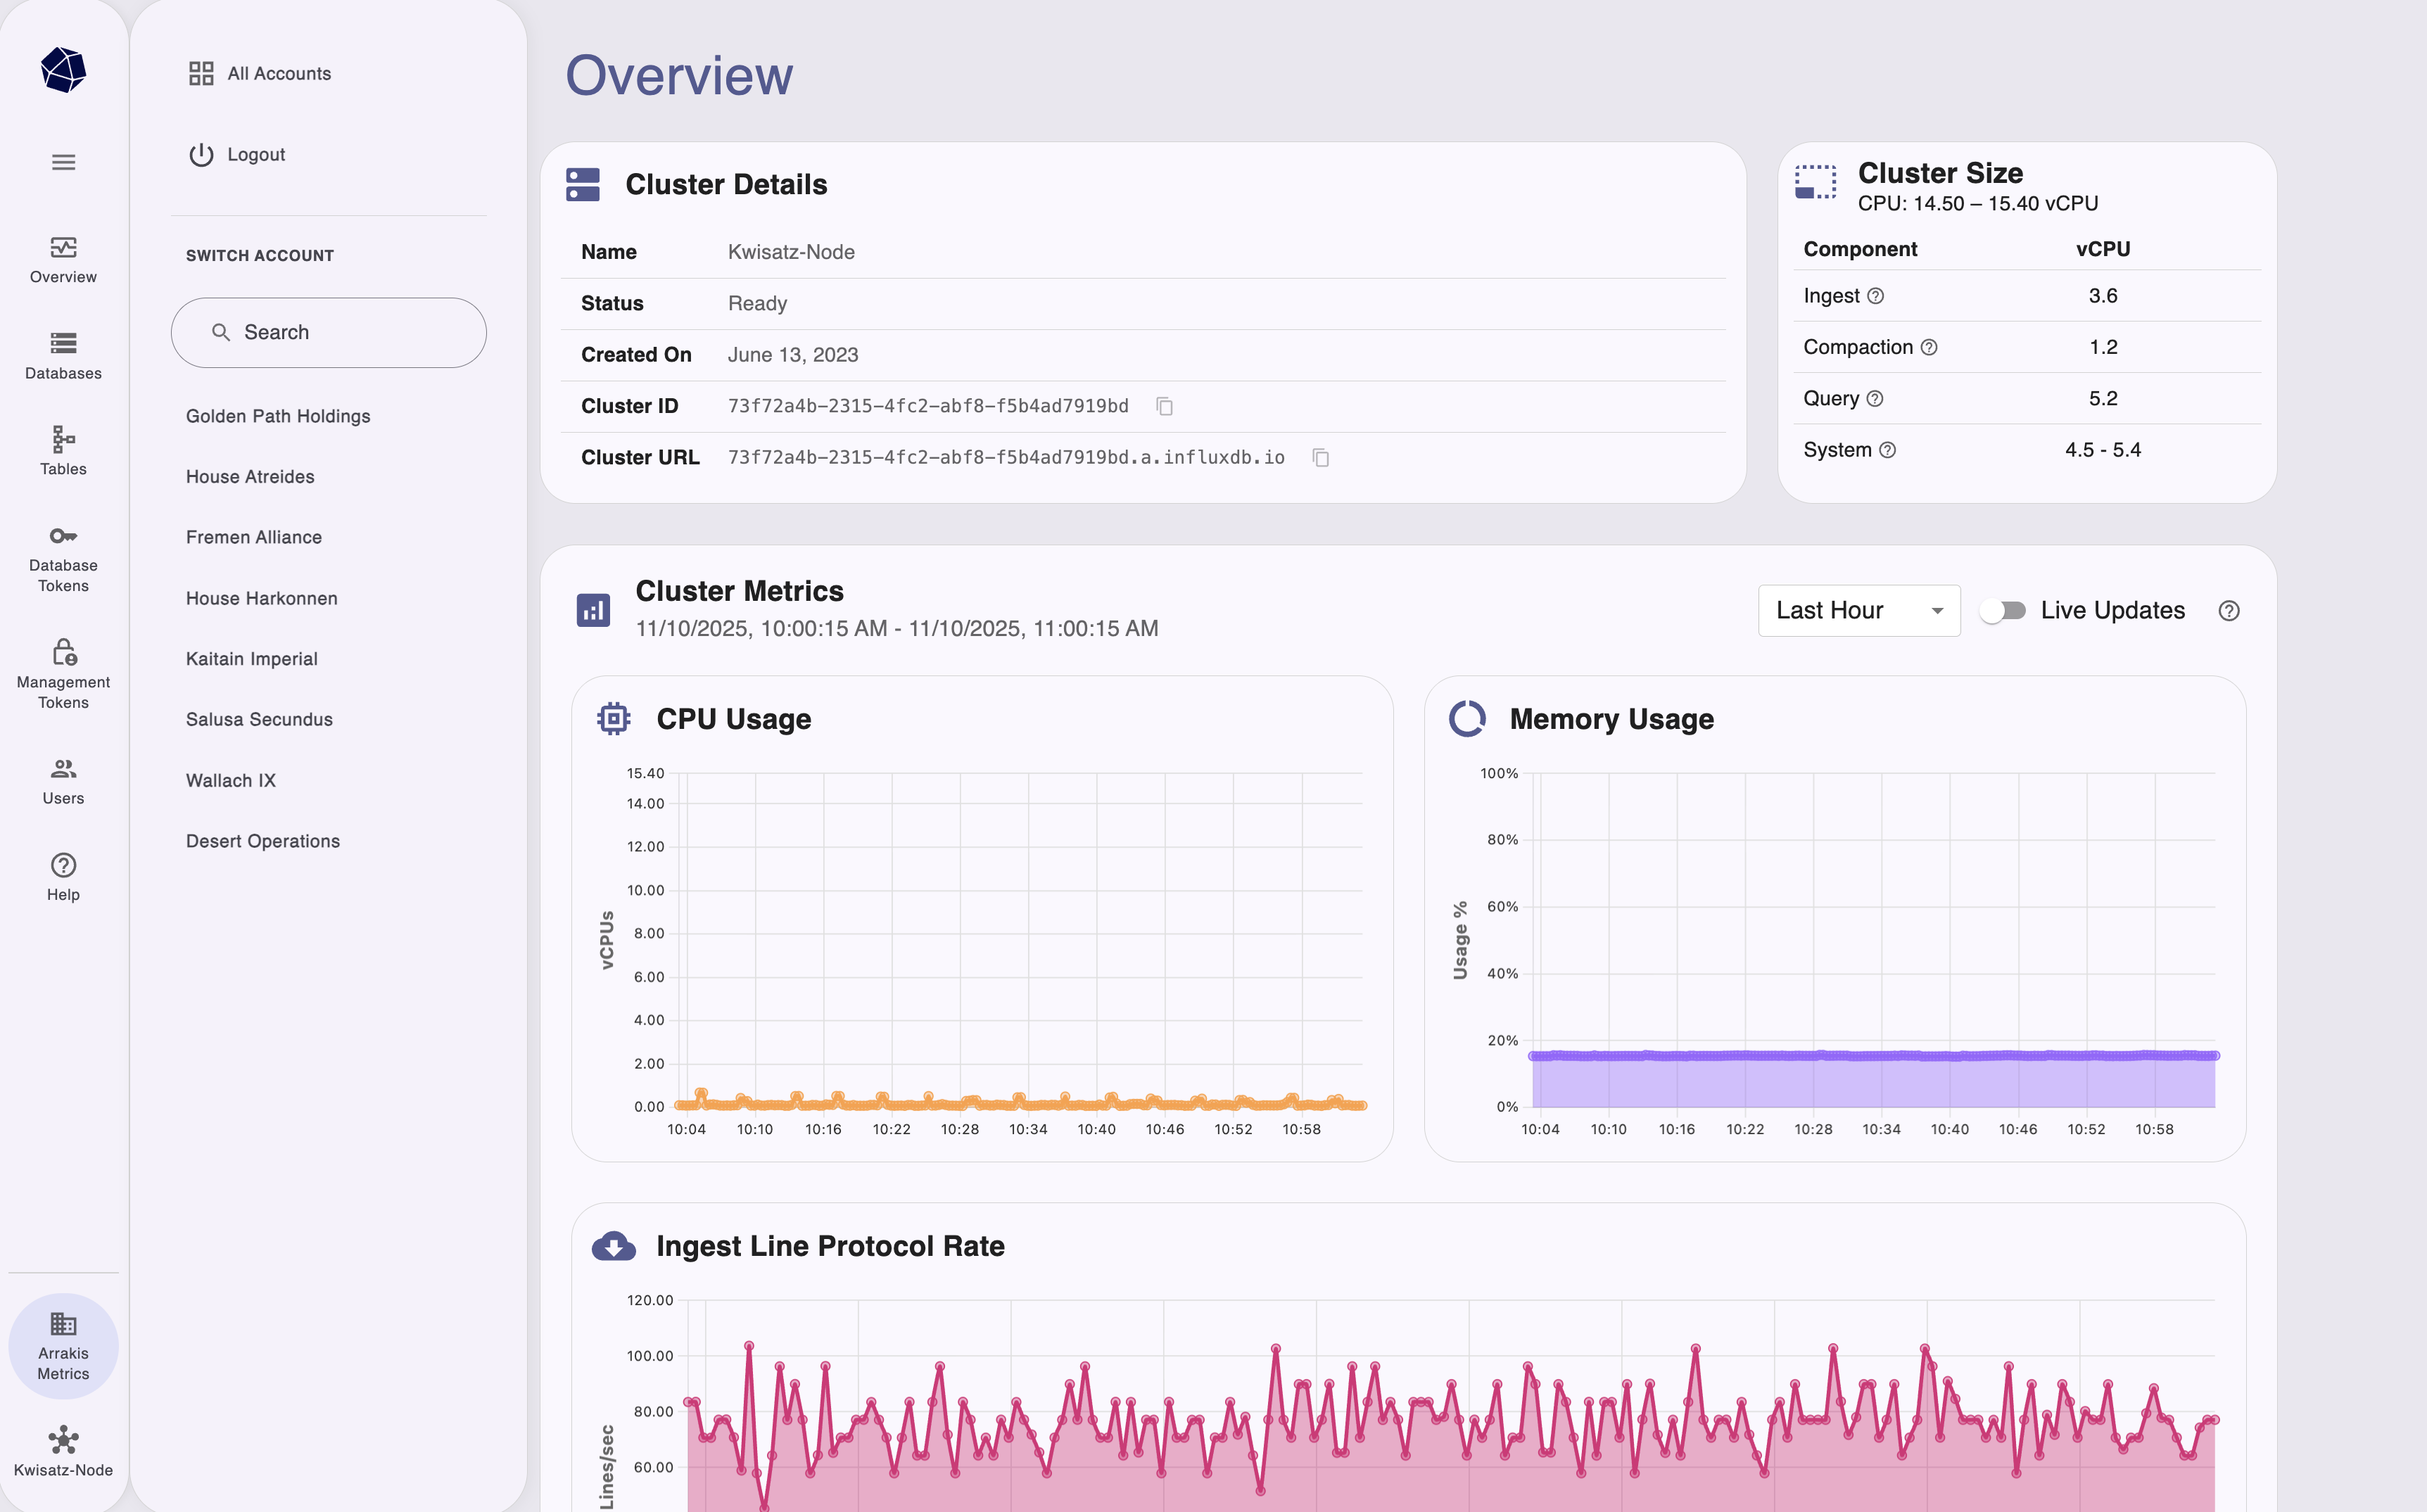
The Admin UI features a collapsible sidebar navigation that provides quick access to all administrative functions:

  • Overview: View cluster details, metrics, and operational status
  • Databases: Create and manage databases
  • Tables: View and manage tables within databases
  • Database Tokens: Create and manage authentication tokens for database operations
  • Management Tokens: Create and manage tokens for account-level administrative tasks
  • Users: View and manage user access and invitations
  • Help: Access documentation, contact support, or reach sales representatives

Account and cluster management

The Admin UI uses a hierarchical navigation system with account and cluster selection at the bottom of the sidebar:

InfluxDB Cloud Dedicated Admin UI account and cluster switcher

Switch between accounts

  1. Click the Account selector at the bottom of the sidebar.
  2. Search for or select an account from the list.
  3. The UI updates to show resources for the selected account.

Switch between clusters

  1. Click the Cluster selector at the bottom of the sidebar.
  2. Search for or select a cluster from the list.
  3. The UI updates to show resources for the selected cluster.
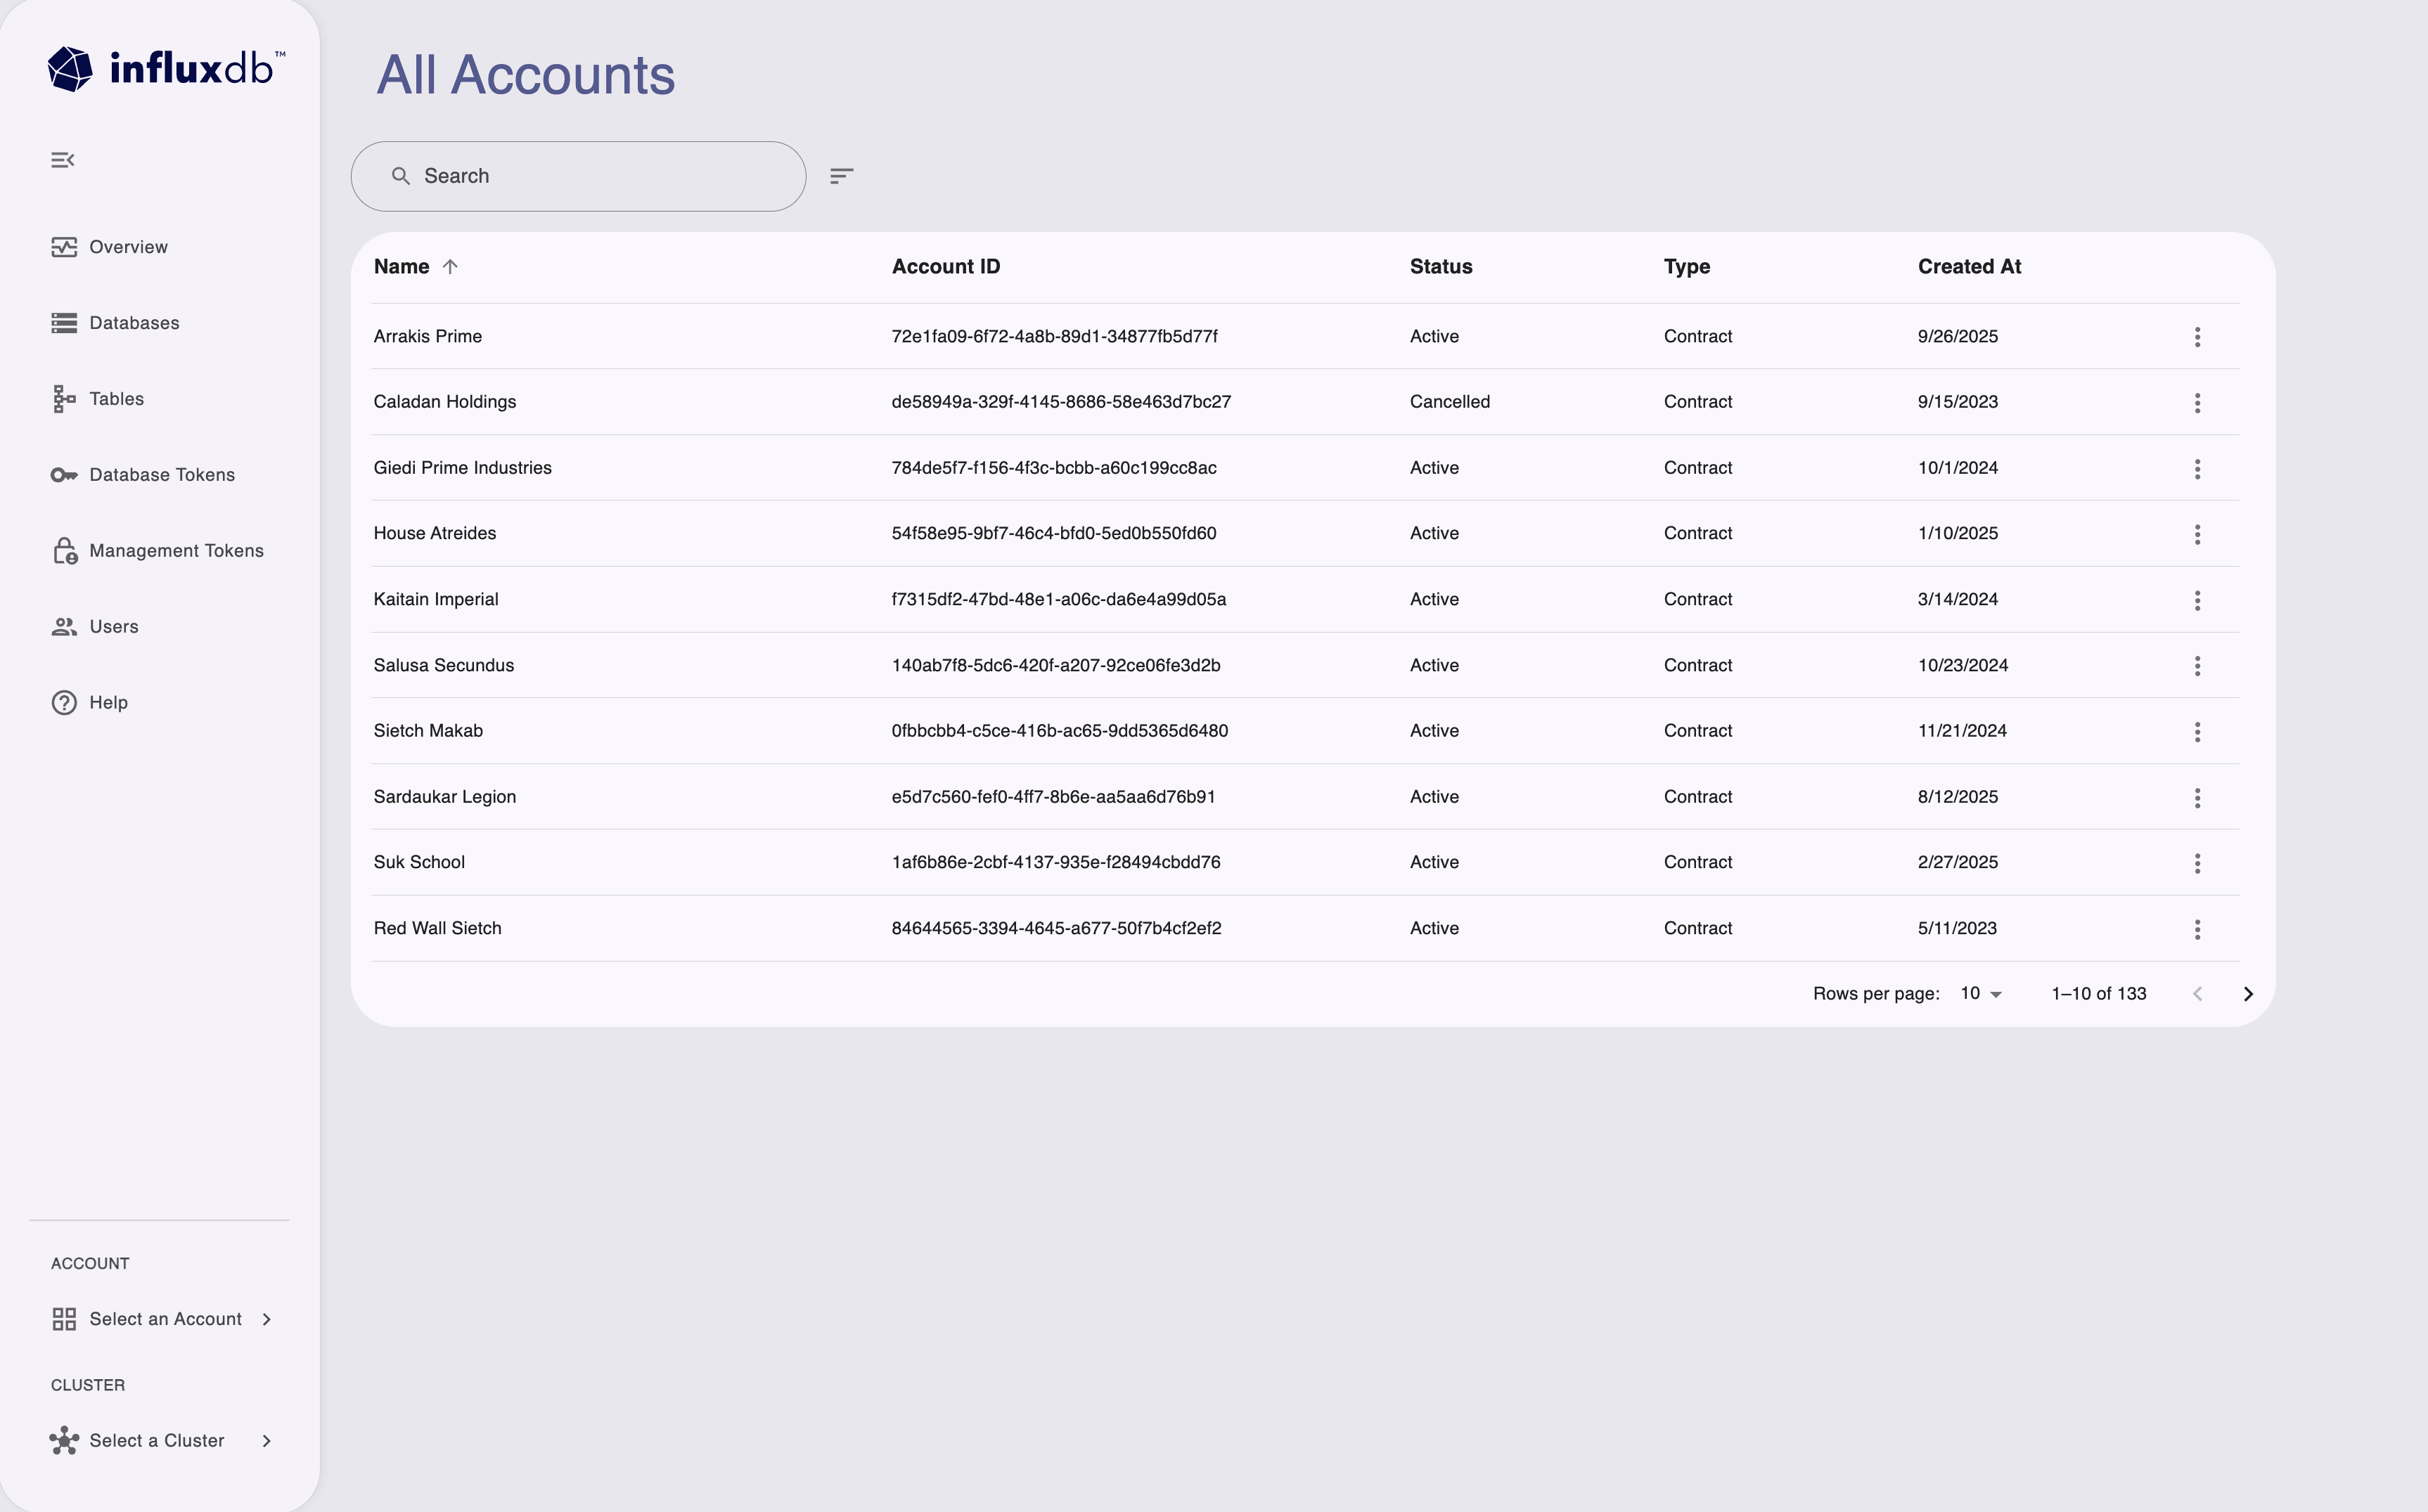
View all accounts

To view all accounts across your organization:

  1. Click All Accounts from the account switcher menu.
  2. View a list of all accounts with their IDs, status, type, and creation dates.
  3. Use the search bar to filter accounts by name or ID.
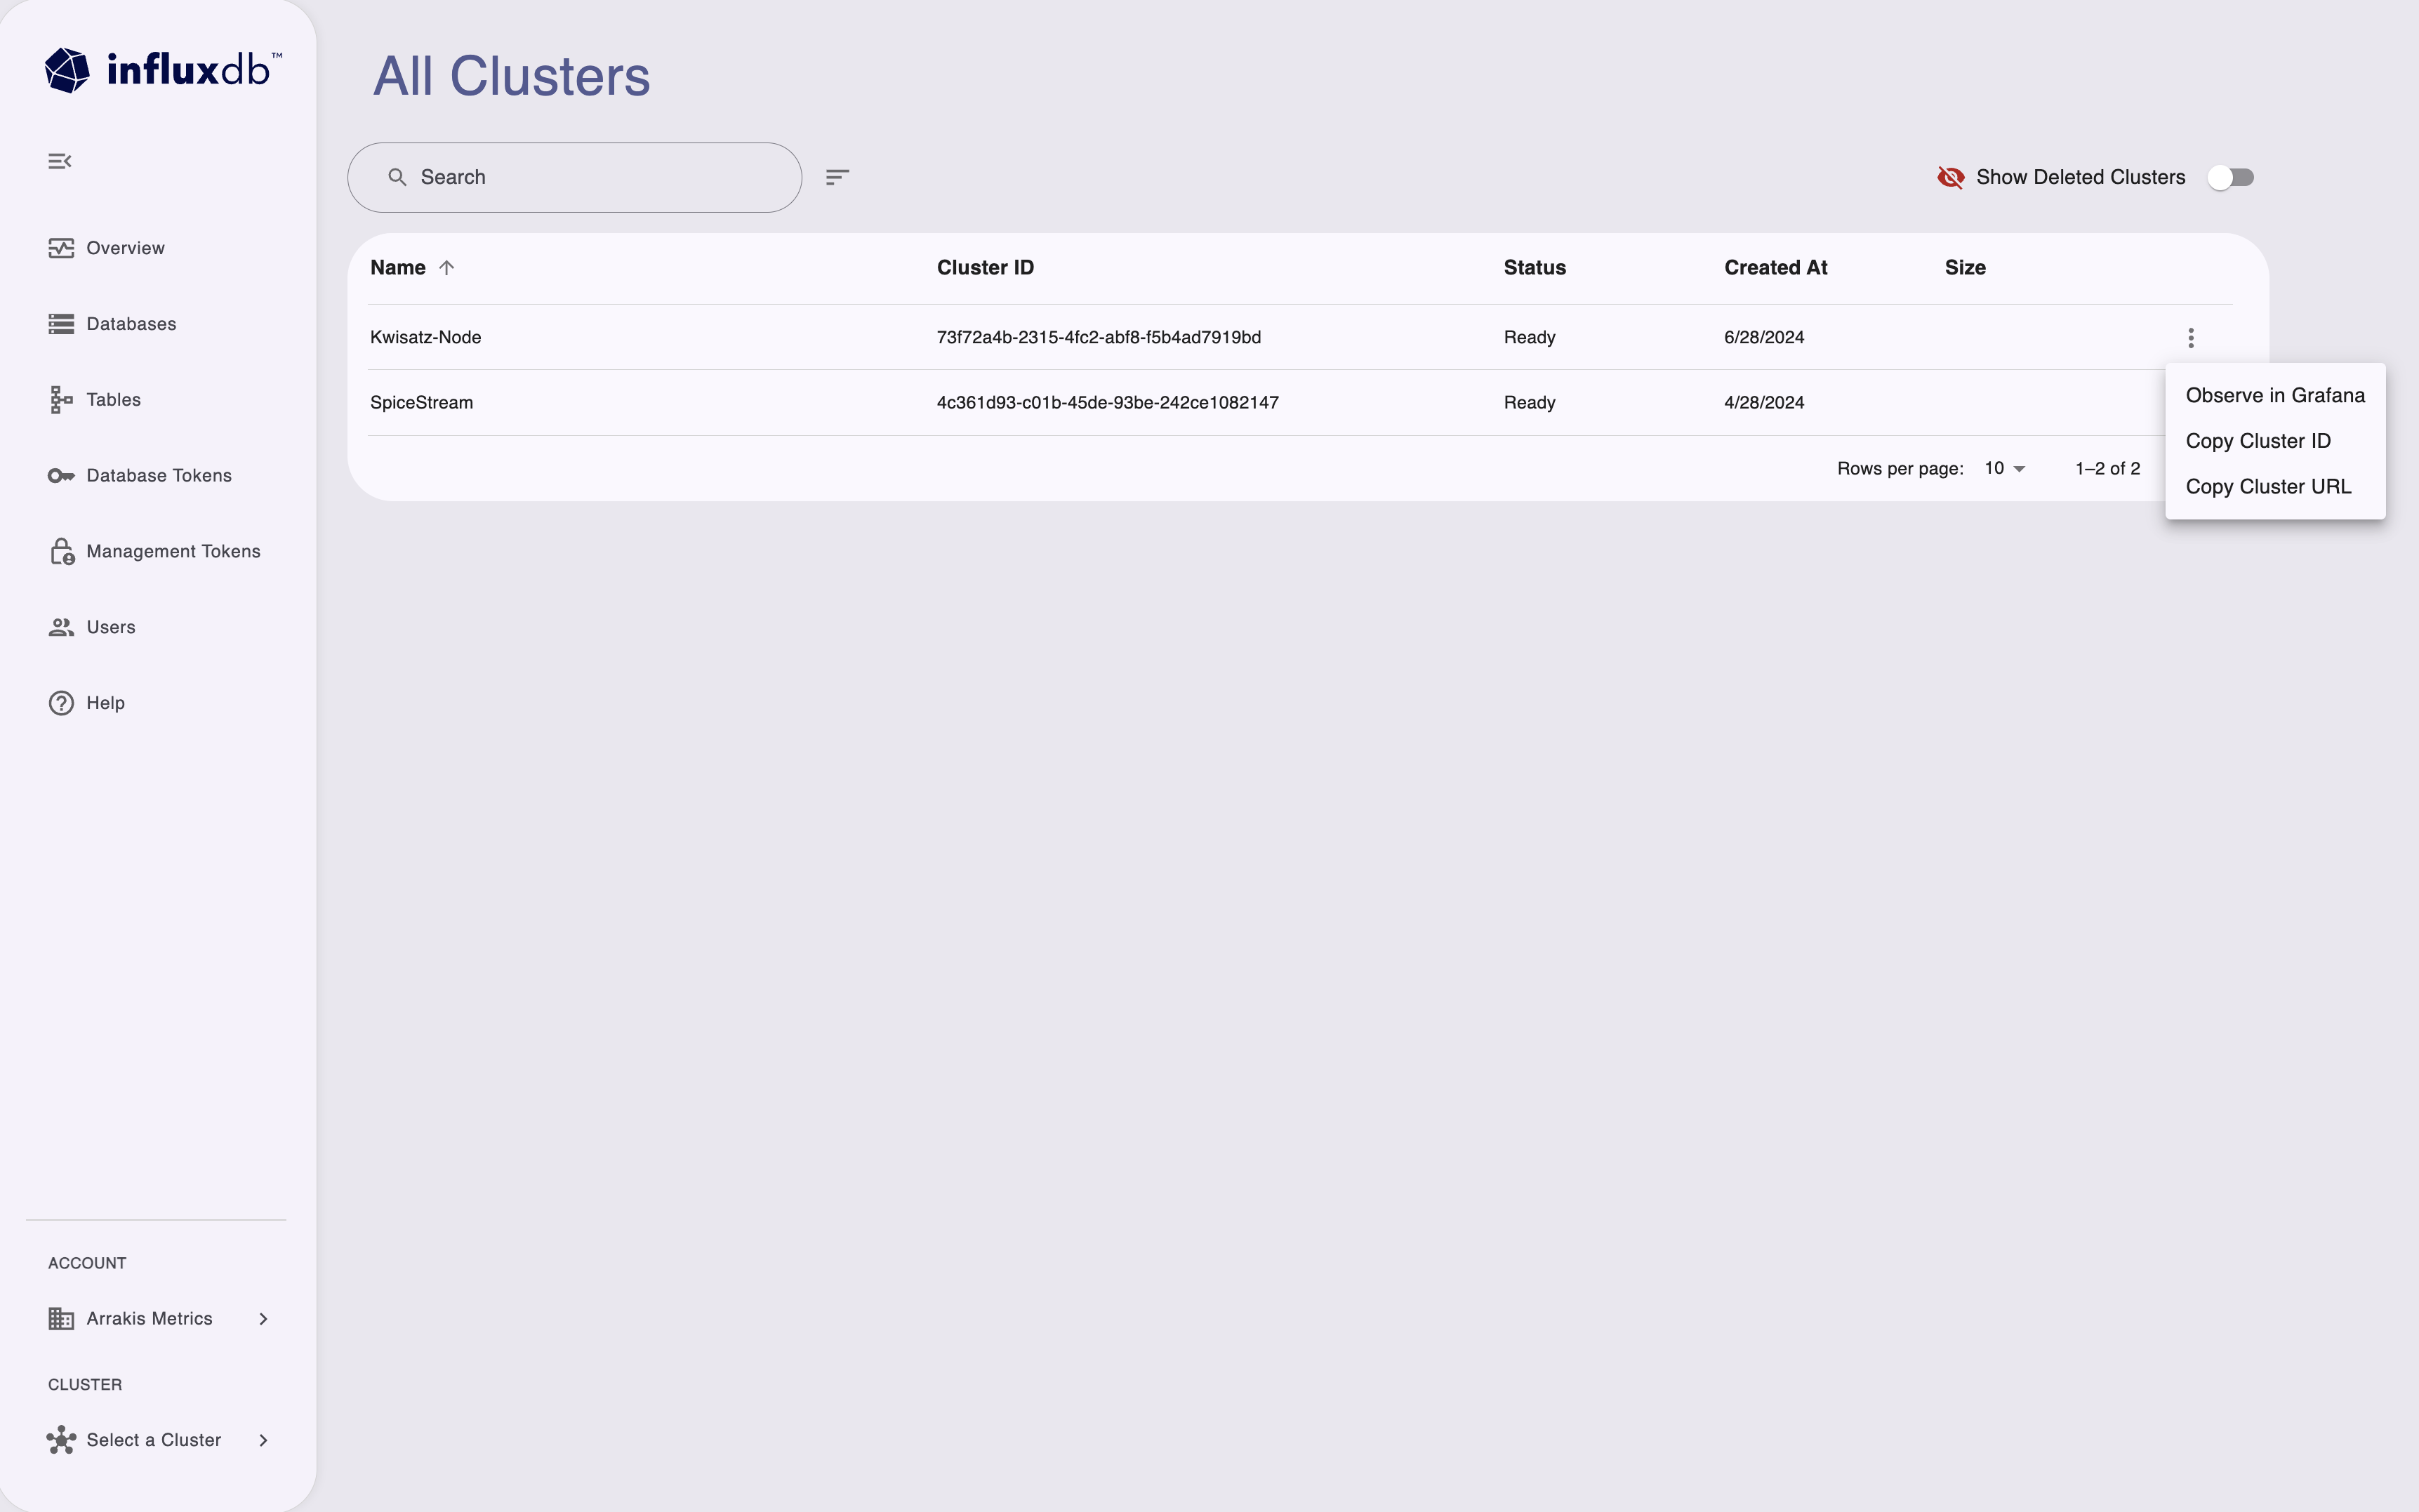
InfluxDB Cloud Dedicated Admin UI all accounts view

View all clusters

To view all clusters in the account:

  1. Click All Clusters from the cluster switcher menu.
  2. Navigate to the clusters list to see all available clusters.
  3. View cluster IDs, status, creation dates, and size information.
  4. Use available actions to copy cluster IDs or URLs, or observe clusters in Grafana (if enabled).
InfluxDB Cloud Dedicated Admin UI all clusters view

For more information about managing clusters, see Manage clusters.

Get help and support

InfluxDB Cloud Dedicated Admin UI help menu

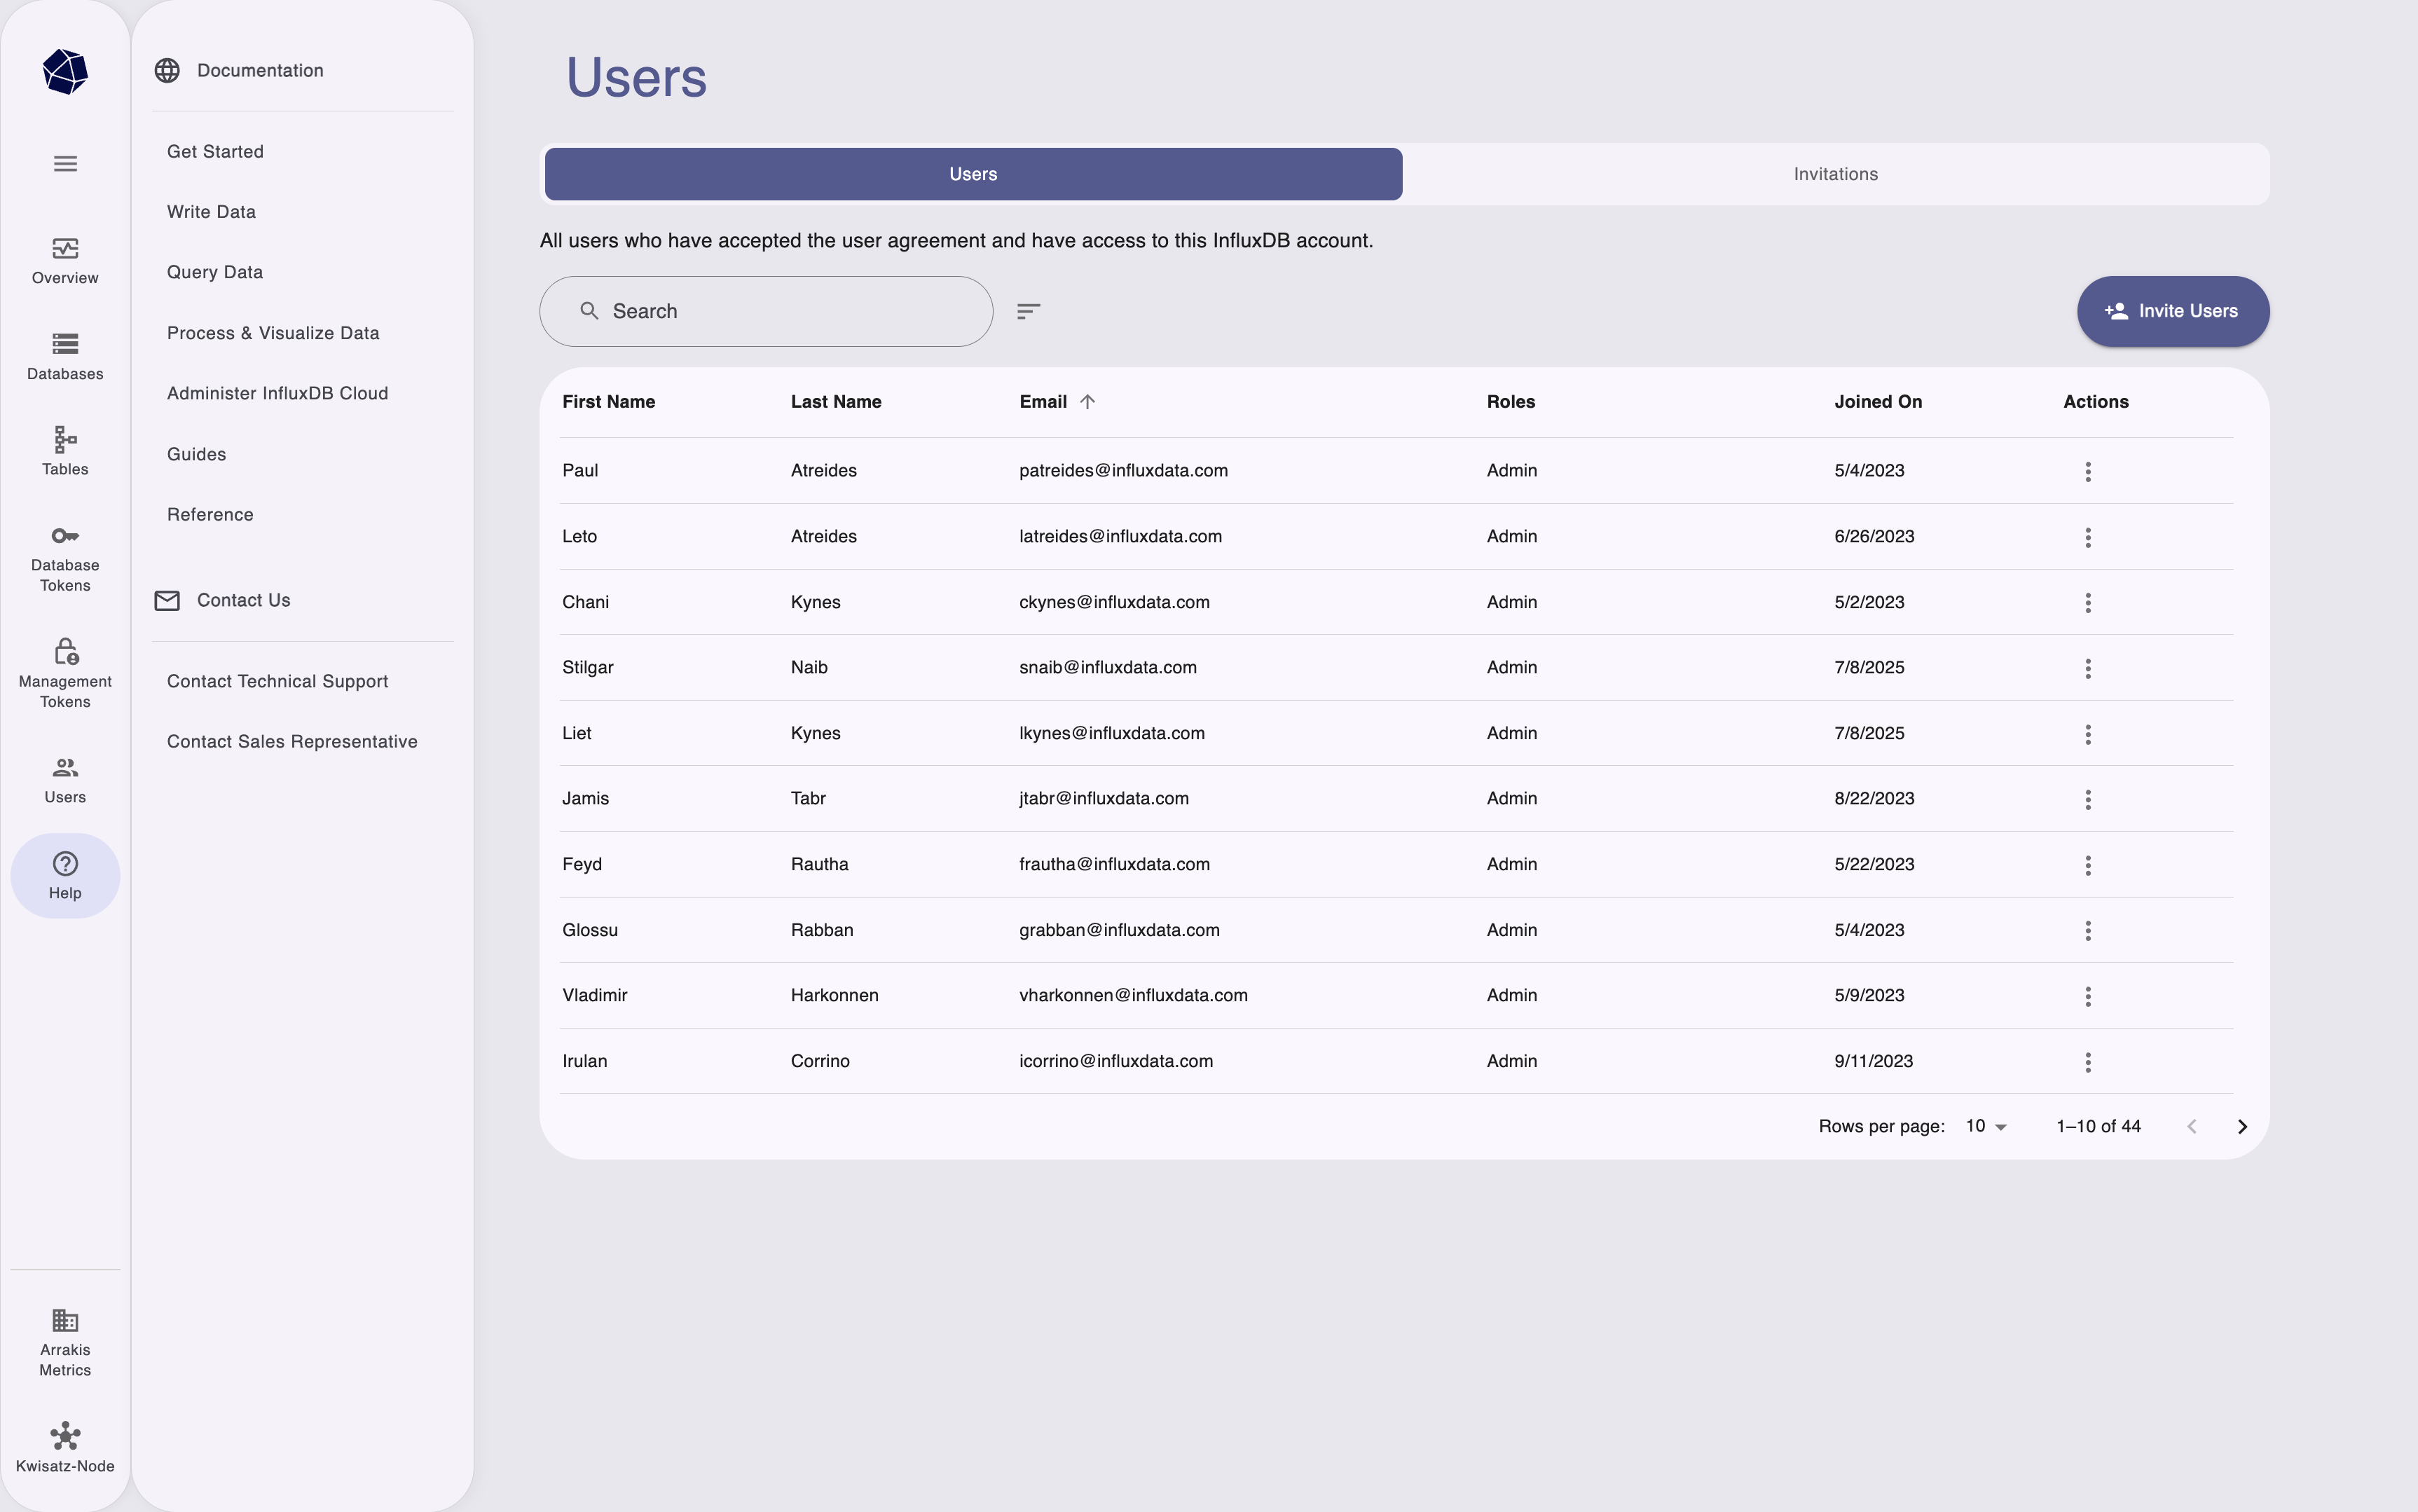
The Help menu in the sidebar provides quick access to:

  • Documentation: Browse getting started guides, data operations, queries, visualizations, and reference documentation
  • Contact Us: Send messages directly to InfluxData support
  • Contact Technical Support: Open technical support tickets
  • Contact Sales Representative: Reach out to the sales team for account and contract inquiries

Access the help menu at any time by clicking the Help icon in the sidebar navigation.


Was this page helpful?

Thank you for your feedback!


InfluxDB OSS 2.9.0: API tokens are hashed by default

Stronger token security in InfluxDB OSS 2.9.0 — tokens are hashed on disk by default. Existing tokens are hashed on first startup and can’t be recovered afterward. Capture any plaintext tokens you still need before you upgrade.

View InfluxDB OSS 2.9.0 release notes

Hashed tokens authenticate exactly like unhashed tokens — clients and integrations keep working.

Also new in 2.9.0:

  • Configurable backup compression
  • Restore support for backups containing hashed tokens
  • Tighter Edge Data Replication queue validation
  • Flux upgrade
  • Compaction reliability improvements

Key enhancements in Explorer 1.8

Explorer 1.8 is now available with streaming data subscriptions (beta), line protocol preview, and query history & saved queries.

View Explorer 1.8 release notes

Explorer 1.8 includes new features and improvements that make it easier to ingest, explore, and manage data.

Highlights:

  • Streaming data subscriptions (beta): Stream data into Explorer from MQTT, Kafka, and AMQP sources.
  • Line protocol preview: Preview line protocol, schema, and parse errors before data is written.
  • Custom sample data: Generate custom sample datasets with line protocol and schema preview.
  • Query history and saved queries: Browse query history and save/re-run named queries.
  • Retention period management: Set, update, or clear retention periods on databases and tables.

For more details, see Explorer 1.8 release notes

InfluxDB 3.9: Performance upgrade preview

InfluxDB 3 Enterprise 3.9 includes a beta of major performance upgrades with faster single-series queries, wide-and-sparse table support, and more.

InfluxDB 3 Enterprise 3.9 includes a beta of major performance and feature updates.

Key improvements:

  • Faster single-series queries
  • Consistent resource usage
  • Wide-and-sparse table support
  • Automatic distinct value caches for reduced latency with metadata queries

Preview features are subject to breaking changes.

For more information, see:

Telegraf Enterprise now in public beta

Get early access to the Telegraf Controller and provide feedback to help shape the future of Telegraf Enterprise.

See the Blog Post

The upcoming Telegraf Enterprise offering is for organizations running Telegraf at scale and is comprised of two key components:

  • Telegraf Controller: A control plane (UI + API) that centralizes Telegraf configuration management and agent health visibility.
  • Telegraf Enterprise Support: Official support for Telegraf Controller and Telegraf plugins.

Join the Telegraf Enterprise beta to get early access to the Telegraf Controller and provide feedback to help shape the future of Telegraf Enterprise.

For more information:

Telegraf Controller v0.0.7-beta now available

Telegraf Controller v0.0.7-beta is now available with new features, improvements, bug fixes, and an important breaking change.

View the release notes
Download Telegraf Controller v0.0.7-beta

InfluxDB Docker latest tag changing to InfluxDB 3 Core

On May 27, 2026, the latest tag for InfluxDB Docker images will point to InfluxDB 3 Core. To avoid unexpected upgrades, use specific version tags in your Docker deployments.

If using Docker to install and run InfluxDB, the latest tag will point to InfluxDB 3 Core. To avoid unexpected upgrades, use specific version tags in your Docker deployments. For example, if using Docker to run InfluxDB v2, replace the latest version tag with a specific version tag in your Docker pull command–for example:

docker pull influxdb:2