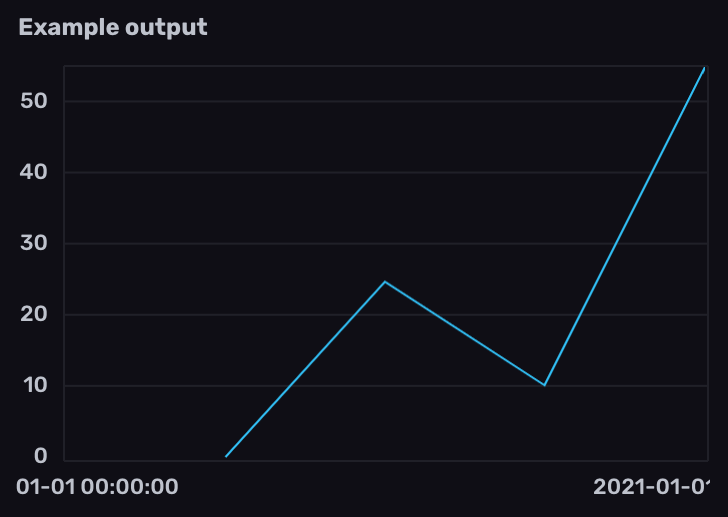
Work with Prometheus counters
Use Flux to query and transform Prometheus counter metrics stored in InfluxDB.
A counter is a cumulative metric that represents a single monotonically increasing counter whose value can only increase or be reset to zero on restart.
Example counter metric in Prometheus format
# HELP example_counter_total Total representing an example counter metric
# TYPE example_counter_total counter
example_counter_total 282327
Because counters can periodically reset to 0, any query involving counter metrics should normalize the data to account for counter resets before further processing.
The examples below include example data collected from the InfluxDB OSS 2.x /metrics endpoint
using prometheus.scrape() and stored in InfluxDB.
Prometheus metric parsing formats
Query structure depends on the Prometheus metric parsing format used to scrape the Prometheus metrics. Select the appropriate metric format version below.
- Normalize counter resets
- Calculate changes between normalized counter values
- Calculate the rate of change in normalized counter values
Normalize counter resets
- Filter results by the
prometheusmeasurement and counter metric name field. - Use
increase()to normalize counter resets.increase()returns the cumulative sum of positive changes in column values.
increase() accounts for counter resets, but may lose some precision on reset
depending on your scrape interval.
On counter reset, increase() assumes no increase.
from(bucket: "example-bucket")
    |> range(start: -1m)
    |> filter(fn: (r) => r._measurement == "prometheus" and r._field == "http_query_request_bytes")
    |> increase()

- Filter results by the counter metric name measurement and
counterfield. - Use
increase()to normalize counter resets.increase()returns the cumulative sum of positive changes in column values.
increase() accounts for counter resets, but may lose some precision on reset
depending on your scrape interval.
On counter reset, increase() assumes no increase.
from(bucket: "example-bucket")
    |> range(start: -1m)
    |> filter(fn: (r) => r._measurement == "http_query_request_bytes" and r._field == "counter")
    |> increase()

Calculate changes between normalized counter values
Use difference() with
normalized counter data to return the difference
between subsequent values.
from(bucket: "example-bucket")
    |> range(start: -1m)
    |> filter(fn: (r) => r._measurement == "prometheus" and r._field == "http_query_request_bytes")
    |> increase()
    |> difference()

from(bucket: "example-bucket")
    |> range(start: -1m)
    |> filter(fn: (r) => r._measurement == "http_query_request_bytes" and r._field == "counter")
    |> increase()
    |> difference()

Calculate the rate of change in normalized counter values
Use derivative() to calculate the rate
of change between normalized counter values.
By default, derivative() returns the rate of change per second.
Use the unit parameter to
customize the rate unit.
from(bucket: "example-bucket")
    |> range(start: -1m)
    |> filter(fn: (r) => r._measurement == "prometheus" and r._field == "http_query_request_bytes")
    |> increase()
    |> derivative()

from(bucket: "example-bucket")
    |> range(start: -1m)
    |> filter(fn: (r) => r._measurement == "http_query_request_bytes" and r._field == "counter")
    |> increase()
    |> derivative()

Calculate the average rate of change in specified time windows
To calculate the average rate of change in normalized counter values in specified time windows:
Import the
experimental/aggregatepackage.Use
aggregate.rate()to calculate the average rate of change per time window.- Use the
everyparameter to define the time window interval. - Use the
unitparameter to customize the rate unit.By default,aggregate.rate()returns the per second (1s) rate of change. - Use the
groupColumnsparameter to specify columns to group by when performing the aggregation.
- Use the
import "experimental/aggregate"

from(bucket: "example-bucket")
    |> range(start: -1m)
    |> filter(fn: (r) => r._measurement == "prometheus" and r._field == "http_query_request_bytes")
    |> increase()
    |> aggregate.rate(every: 15s, unit: 1s)

import "experimental/aggregate"

from(bucket: "example-bucket")
    |> range(start: -1m)
    |> filter(fn: (r) => r._measurement == "http_query_request_bytes" and r._field == "counter")
    |> increase()
    |> aggregate.rate(every: 15s, unit: 1s)

Was this page helpful?
Thank you for your feedback!
Support and feedback
Thank you for being part of our community! We welcome and encourage your feedback and bug reports for Flux and this documentation. To find support, use the following resources:
Customers with an annual or support contract can contact InfluxData Support.
