
Work with Prometheus gauges
Use Flux to query and transform Prometheus gauge metrics stored in InfluxDB.
A gauge is a metric that represents a single numerical value that can arbitrarily go up and down.
Example gauge metric in Prometheus data
# HELP example_gauge_current Current number of items as example gauge metric
# TYPE example_gauge_current gauge
example_gauge_current 128Generally gauge metrics can be used as they are reported and don’t require any additional processing.
The examples below include example data collected from the InfluxDB OSS 2.x /metrics endpoint
using prometheus.scrape() and stored in InfluxDB.
Prometheus metric parsing formats
Query structure depends on the Prometheus metric parsing format used to scrape the Prometheus metrics. Select the appropriate metric format version below.
- Calculate the rate of change in gauge values
- Calculate the average rate of change in specified time windows
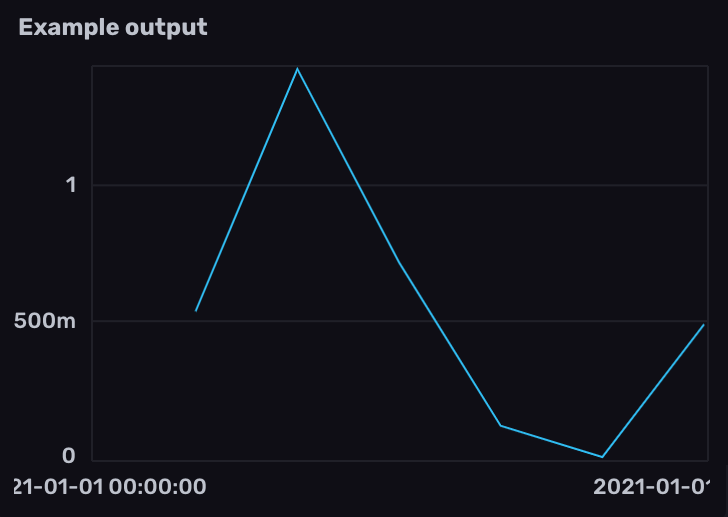
Calculate the rate of change in gauge values
- Filter results by the
prometheusmeasurement and counter metric name field. - Use
derivative()to calculate the rate of change between gauge values. By default,derivative()returns the rate of change per second. Use theunitparameter to customize the rate unit. To replace negative derivatives with null values, set thenonNegativeparameter totrue.
from(bucket: "example-bucket")
    |> range(start: -1m)
    |> filter(fn: (r) => r._measurement == "prometheus" and r._field == "go_goroutines")
    |> derivative(nonNegative: true)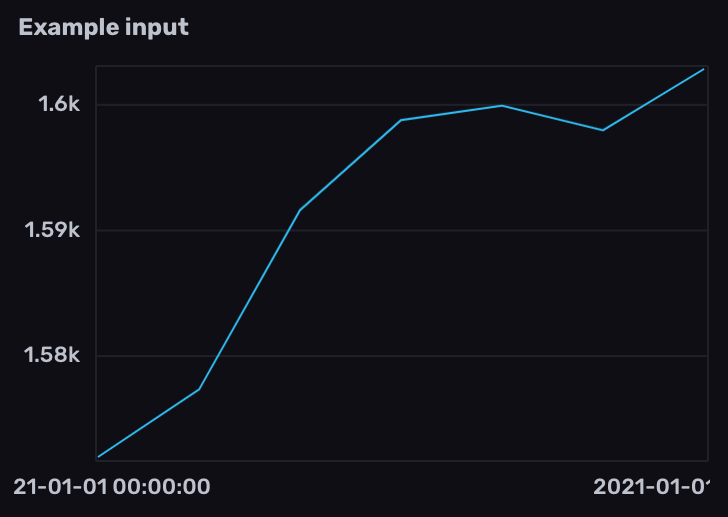
- Filter results by the counter metric name measurement and
gaugefield. - Use
derivative()to calculate the rate of change between gauge values. By default,derivative()returns the rate of change per second. Use theunitparameter to customize the rate unit. To replace negative derivatives with null values, set thenonNegativeparameter totrue.
from(bucket: "example-bucket")
    |> range(start: -1m)
    |> filter(fn: (r) => r._measurement == "go_goroutines" and r._field == "gauge")
|> derivative(nonNegative: true)Calculate the average rate of change in specified time windows
Import the
experimental/aggregatepackage.Filter results by the
prometheusmeasurement and counter metric name field.Use
aggregate.rate()to calculate the average rate of change per time window.- Use the
everyparameter to define the time window interval. - Use the
unitparameter to customize the rate unit. By default,aggregate.rate()returns the per second (1s) rate of change. - Use the
groupColumnsparameter to specify columns to group by when performing the aggregation.
- Use the
import "experimental/aggregate"

from(bucket: "example-bucket")
    |> range(start: -1m)
    |> filter(fn: (r) => r._measurement == "prometheus" and r._field == "go_goroutines")
    |> aggregate.rate(every: 10s, unit: 1s)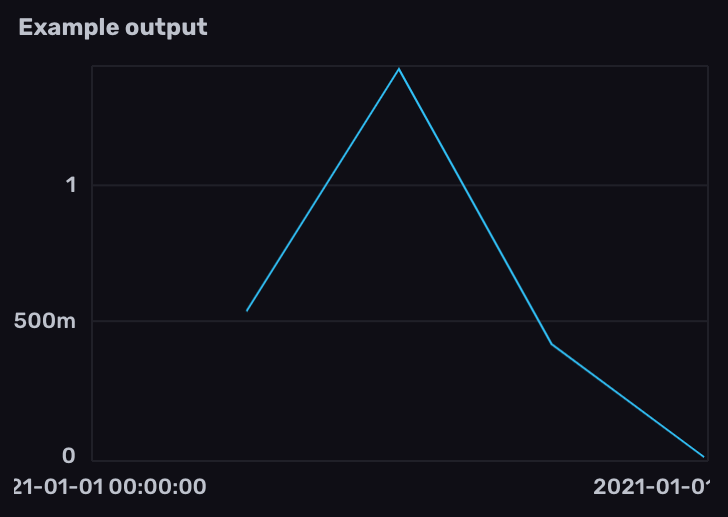
Import the
experimental/aggregatepackage.Filter results by the counter metric name measurement and
gaugefield.Use
aggregate.rate()to calculate the average rate of change per time window.- Use the
everyparameter to define the time window interval. - Use the
unitparameter to customize the rate unit. By default,aggregate.rate()returns the per second (1s) rate of change. - Use the
groupColumnsparameter to specify columns to group by when performing the aggregation.
- Use the
import "experimental/aggregate"

from(bucket: "example-bucket")
    |> range(start: -1m)
    |> filter(fn: (r) => r._measurement == "go_goroutines" and r._field == "gauge")
|> aggregate.rate(every: 10s, unit: 1s)Was this page helpful?
Thank you for your feedback!
Support and feedback
Thank you for being part of our community! We welcome and encourage your feedback and bug reports for Flux and this documentation. To find support, use the following resources:
Customers with an annual or support contract can contact InfluxData Support.