
Troubleshoot out-of-memory loops
Out-of-memory (OOM) loops occur when a running process consumes an increasing amount of memory until the operating system is forced to kill and restart the process. When the process is killed, memory allocated to the process is released, but after restarting, it continues to use more and more RAM until the cycle repeats.
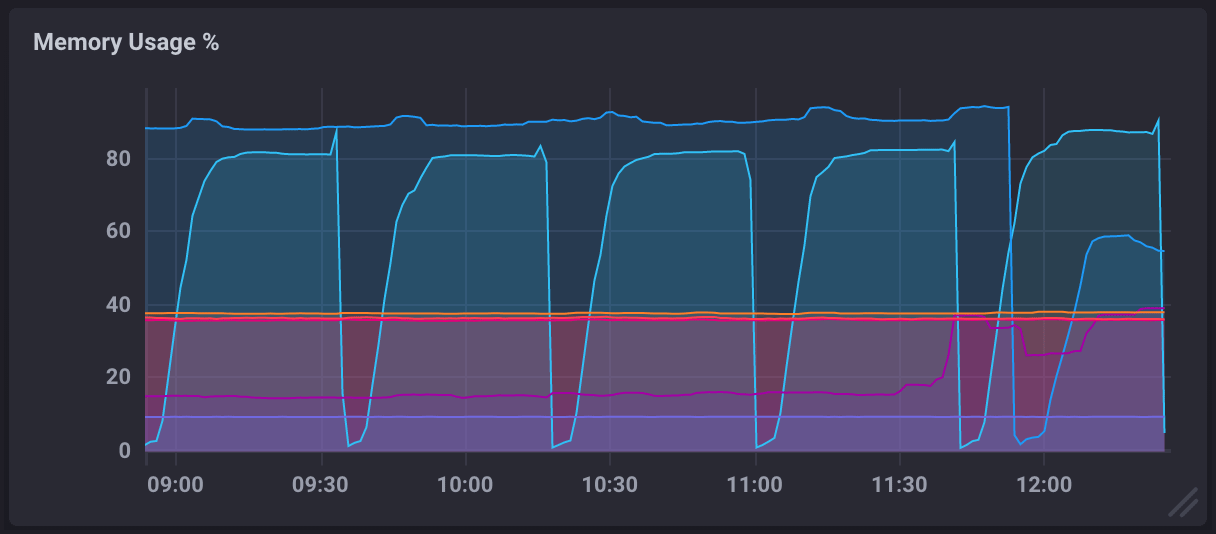
In a monitoring dashboard, an OOM loop will appear in the Memory Usage % metric and look similar to the following:
Potential causes
The causes of OOM loops can vary widely and depend on your specific use case of the TICK stack, but the following is the most common:
Unoptimized queries
What is queried and how it’s queried can drastically affect the memory usage and performance of InfluxDB. An OOM loop will occur as a result of a repeated issuance of a query which exhausts memory. For example, a dashboard cell with which is set to refresh every 30s.
Selecting a measurement without specifying a time range
When selecting from a measurement without specifying a time range, InfluxDB attempts to pull data points from the beginning of UNIX epoch time (00:00:00 UTC on 1 January 1970), storing the returned data in memory until it’s ready for output. The operating system will eventually kill the process due to high memory usage.
Example of selecting a measurement without a time range
SELECT * FROM "telegraf"."autogen"."cpu"Solutions
Identify and update unoptimized queries
The most common cause of OOM loops in InfluxDB is unoptimized queries, but it can be challenging to identify what queries could be better optimized. InfluxQL includes tools to help identify the “cost” of queries and gain insight into what queries have room for optimization.
View your InfluxDB logs
If a query is killed, it is logged by InfluxDB. View your InfluxDB logs for hints as to what queries are being killed.
Estimate query cost
InfluxQL’s EXPLAIN statement
parses and plans a query, then outputs a summary of estimated costs.
This allows you to estimate how resource-intensive a query may be before having to
run the actual query.
Example EXPLAIN statement
> EXPLAIN SELECT * FROM "telegraf"."autogen"."cpu"

QUERY PLAN
----------
EXPRESSION: <nil>
AUXILIARY FIELDS: cpu::tag, host::tag, usage_guest::float, usage_guest_nice::float, usage_idle::float, usage_iowait::float, usage_irq::float, usage_nice::float, usage_softirq::float, usage_steal::float, usage_system::float, usage_user::float
NUMBER OF SHARDS: 12
NUMBER OF SERIES: 108
CACHED VALUES: 38250
NUMBER OF FILES: 1080
NUMBER OF BLOCKS: 10440
SIZE OF BLOCKS: 23252999
EXPLAINwill only output what iterators are created by the query engine. It does not capture any other information within the query engine such as how many points will actually be processed.
Analyze actual query cost
InfluxQL’s EXPLAIN ANALYZE statement
actually executes a query and counts the costs during runtime.
Example EXPLAIN ANALYZE statement
> EXPLAIN ANALYZE SELECT * FROM "telegraf"."autogen"."cpu" WHERE time > now() - 1d

EXPLAIN ANALYZE
---------------
.
└── select
    ├── execution_time: 104.608549ms
    ├── planning_time: 5.08487ms
    ├── total_time: 109.693419ms
    └── build_cursor
        ├── labels
        │   └── statement: SELECT cpu::tag, host::tag, usage_guest::float, usage_guest_nice::float, usage_idle::float, usage_iowait::float, usage_irq::float, usage_nice::float, usage_softirq::float, usage_steal::float, usage_system::float, usage_user::float FROM telegraf.autogen.cpu
        └── iterator_scanner
            ├── labels
            │   └── auxiliary_fields: cpu::tag, host::tag, usage_guest::float, usage_guest_nice::float, usage_idle::float, usage_iowait::float, usage_irq::float, usage_nice::float, usage_softirq::float, usage_steal::float, usage_system::float, usage_user::float
            └── create_iterator
                ├── labels
                │   ├── measurement: cpu
                │   └── shard_id: 317
                ├── cursors_ref: 0
                ├── cursors_aux: 90
                ├── cursors_cond: 0
                ├── float_blocks_decoded: 450
                ├── float_blocks_size_bytes: 960943
                ├── integer_blocks_decoded: 0
                ├── integer_blocks_size_bytes: 0
                ├── unsigned_blocks_decoded: 0
                ├── unsigned_blocks_size_bytes: 0
                ├── string_blocks_decoded: 0
                ├── string_blocks_size_bytes: 0
                ├── boolean_blocks_decoded: 0
                ├── boolean_blocks_size_bytes: 0
                └── planning_time: 4.523978ms
Scale available memory
If possible, increase the amount of memory available to InfluxDB. This is easier if running in a virtualized or cloud environment where resources can be scaled on the fly. In environments with a fixed set of resources, this can be a very difficult challenge to overcome.
Was this page helpful?
Thank you for your feedback!
Support and feedback
Thank you for being part of our community! We welcome and encourage your feedback and bug reports for and this documentation. To find support, use the following resources:
Customers with an annual or support contract can contact InfluxData Support.