Calculate percentages in a query
This page documents an earlier version of InfluxDB OSS. InfluxDB 3 Core is the latest stable version.
Use Flux or InfluxQL to calculate percentages in a query.
Flux lets you perform simple math equations, for example, calculating a percentage.
Calculate a percentage
Learn how to calculate a percentage using the following examples:
- Basic calculations within a query
- Calculate a percentage from two fields
- Calculate a percentage using aggregate functions
- Calculate the percentage of total weight per apple variety
- Calculate the aggregate percentage per variety
Basic calculations within a query
When performing any math operation in a Flux query, you must complete the following steps:
- Specify the bucket to query from and the time range to query.
- Filter your data by measurements, fields, and other applicable criteria.
- Align values in one row (required to perform math in Flux) by using one of the following functions:
- To query from multiple data sources, use the
join()function. - To query from the same data source, use the
pivot()function.
- To query from multiple data sources, use the
For examples using the join() function to calculate percentages and more examples of calculating percentages, see Calculate percentages with Flux.
Data variable
To shorten examples, we’ll store a basic Flux query in a data variable for reuse.
Here’s how that looks in Flux:
// Query data from the past 15 minutes pivot fields into columns so each row
// contains values for each field
data = from(bucket:"your_db/your_retention_policy")
  |> range(start: -15m)
  |> filter(fn: (r) =>  r._measurement == "measurement_name" and r._field =~ /field[1-2]/)
  |> pivot(rowKey:["_time"], columnKey: ["_field"], valueColumn: "_value")
Each row now contains the values necessary to perform a math operation. For example, to add two field keys, start with the data variable created above, and then use map() to re-map values in each row.
data
 |> map(fn: (r) => ({ r with _value: r.field1 + r.field2}))
Note: Flux supports basic math operators such as
+,-,/,*, and(). For example, to subtractfield2fromfield1, change+to-.
Calculate a percentage from two fields
Use the data variable created above, and then use the map() function to divide one field by another, multiply by 100, and add a new percent field to store the percentage values in.
data
   |> map(fn: (r) => ({
    _time: r._time,
    _measurement: r._measurement,
    _field: "percent",
    _value: field1 / field2 * 100.0
  }))
Note: In this example,
field1andfield2are float values, hence multiplied by 100.0. For integer values, multiply by 100 or use thefloat()function to cast integers to floats.
Calculate a percentage using aggregate functions
Use aggregateWindow() to window data by time and perform an aggregate function on each window.
from(bucket:"<database>/<retention_policy>")
  |> range(start: -15m)
  |> filter(fn: (r) =>  r._measurement == "measurement_name" and r._field =~ /fieldkey[1-2]/)
  |> aggregateWindow(every: 1m, fn:sum)
  |> pivot(rowKey:["_time"], columnKey: ["_field"], valueColumn: "_value")
  |> map(fn: (r) => ({ r with _value: r.field1 / r.field2 * 100.0 }))
Calculate the percentage of total weight per apple variety
Use simulated apple stand data to track the weight of apples (by type) throughout a day.
- Download the sample data
- Import the sample data:
influx -import -path=path/to/apple_stand.txt -precision=ns -database=apple_standUse the following query to calculate the percentage of the total weight each variety accounts for at each given point in time.
from(bucket:"apple_stand/autogen")
    |> range(start: 2018-06-18T12:00:00Z, stop: 2018-06-19T04:35:00Z)
    |> filter(fn: (r) =>  r._measurement == "variety")
    |> pivot(rowKey:["_time"], columnKey: ["_field"], valueColumn: "_value")
    |> map(fn: (r) => ({ r with
      granny_smith: r.granny_smith / r.total_weight * 100.0 ,
      golden_delicious: r.golden_delicious / r.total_weight * 100.0 ,
      fuji: r.fuji / r.total_weight * 100.0 ,
      gala: r.gala / r.total_weight * 100.0 ,
      braeburn: r.braeburn / r.total_weight * 100.0 ,}))
Calculate the average percentage of total weight per variety each hour
With the apple stand data from the prior example, use the following query to calculate the average percentage of the total weight each variety accounts for per hour.
from(bucket:"apple_stand/autogen")
  |> range(start: 2018-06-18T00:00:00.00Z, stop: 2018-06-19T16:35:00.00Z)
  |> filter(fn: (r) => r._measurement == "variety")
  |> aggregateWindow(every:1h, fn: mean)
  |> pivot(rowKey:["_time"], columnKey: ["_field"], valueColumn: "_value")
  |> map(fn: (r) => ({ r with
    granny_smith: r.granny_smith / r.total_weight * 100.0,
    golden_delicious: r.golden_delicious / r.total_weight * 100.0,
    fuji: r.fuji / r.total_weight * 100.0,
    gala: r.gala / r.total_weight * 100.0,
    braeburn: r.braeburn / r.total_weight * 100.0
  }))
InfluxQL lets you perform simple math equations which makes calculating percentages using two fields in a measurement pretty simple. However there are some caveats of which you need to be aware.
Basic calculations within a query
SELECT statements support the use of basic math operators such as +,-,/, *, (), etc.
-- Add two field keys
SELECT field_key1 + field_key2 AS "field_key_sum" FROM "measurement_name" WHERE time < now() - 15m

-- Subtract one field from another
SELECT field_key1 - field_key2 AS "field_key_difference" FROM "measurement_name" WHERE time < now() - 15m

-- Grouping and chaining mathematical calculations
SELECT (field_key1 + field_key2) - (field_key3 + field_key4) AS "some_calculation" FROM "measurement_name" WHERE time < now() - 15m
Calculating a percentage in a query
Using basic math functions, you can calculate a percentage by dividing one field value by another and multiplying the result by 100:
SELECT (field_key1 / field_key2) * 100 AS "calculated_percentage" FROM "measurement_name" WHERE time < now() - 15mCalculating a percentage using aggregate functions
If using aggregate functions in your percentage calculation, all data must be referenced using aggregate functions. You can’t mix aggregate and non-aggregate data.
All Aggregate functions need a GROUP BY time() clause defining the time intervals
in which data points are grouped and aggregated.
SELECT (sum(field_key1) / sum(field_key2)) * 100 AS "calculated_percentage" FROM "measurement_name" WHERE time < now() - 15m GROUP BY time(1m)Examples
Sample data
The following example uses simulated Apple Stand data that tracks the weight of baskets containing different varieties of apples throughout a day of business.
- Download the sample data
- Import the sample data:
influx -import -path=path/to/apple_stand.txt -precision=ns -database=apple_standCalculating percentage of total weight per apple variety
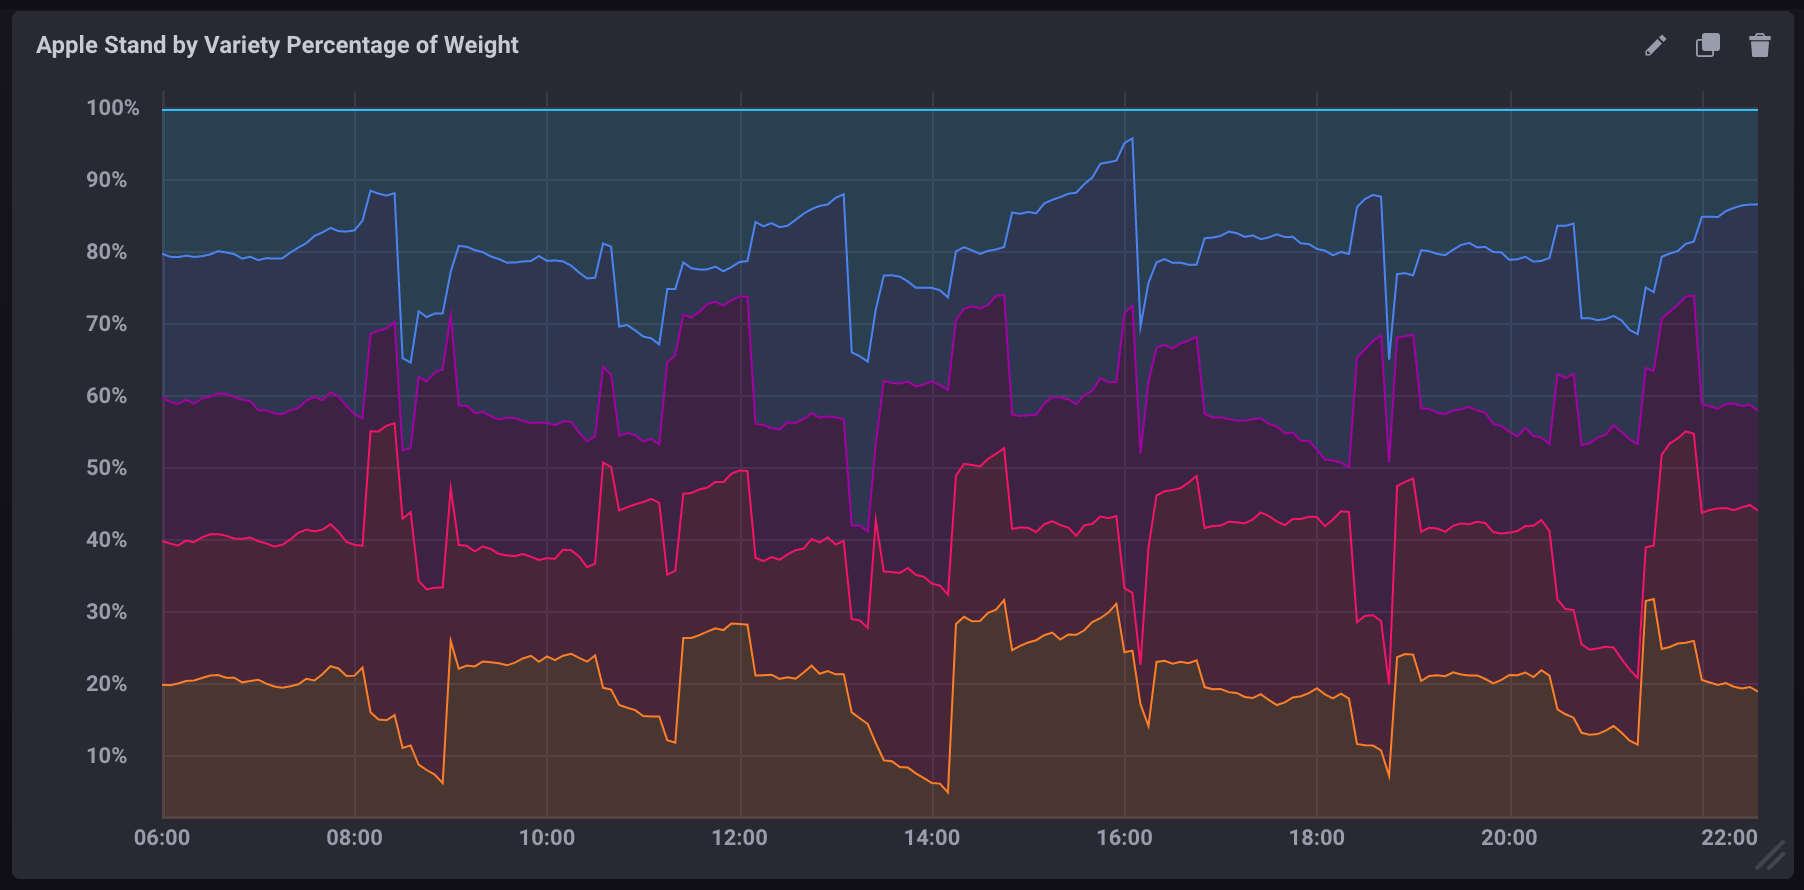
The following query calculates the percentage of the total weight each variety accounts for at each given point in time.
SELECT
    ("braeburn"/total_weight)*100,
    ("granny_smith"/total_weight)*100,
    ("golden_delicious"/total_weight)*100,
    ("fuji"/total_weight)*100,
    ("gala"/total_weight)*100
FROM "apple_stand"."autogen"."variety"If visualized as a stacked graph in Chronograf, it would look like:

Calculating aggregate percentage per variety
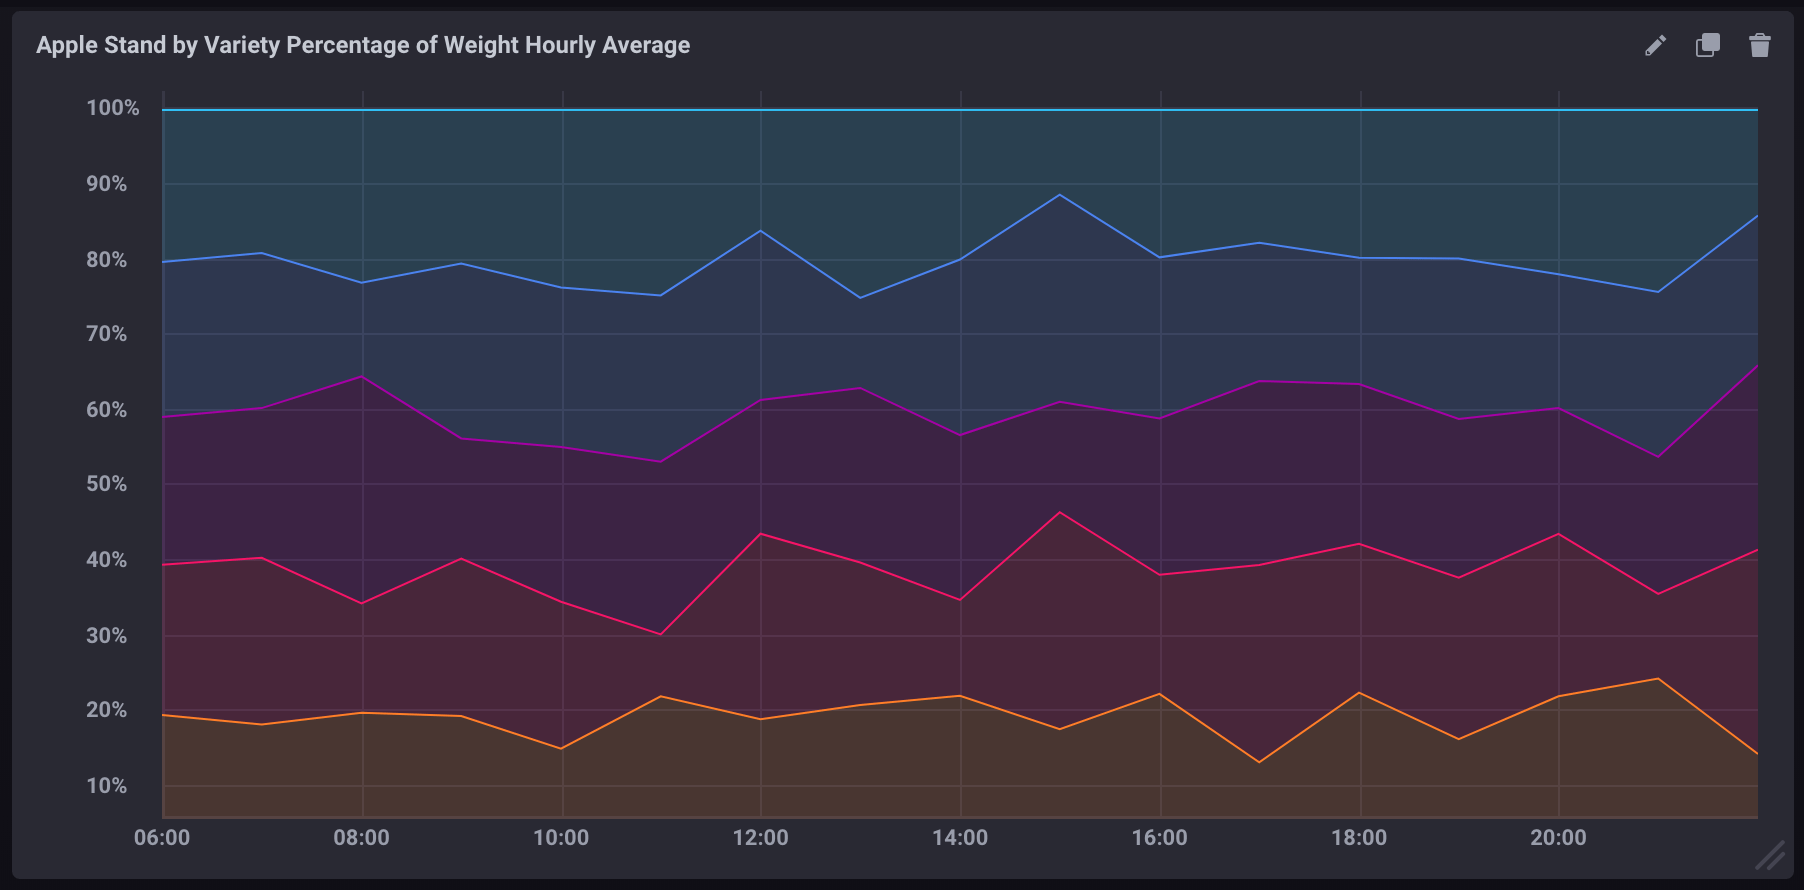
The following query calculates the average percentage of the total weight each variety accounts for per hour.
SELECT
    (mean("braeburn")/mean(total_weight))*100,
    (mean("granny_smith")/mean(total_weight))*100,
    (mean("golden_delicious")/mean(total_weight))*100,
    (mean("fuji")/mean(total_weight))*100,
    (mean("gala")/mean(total_weight))*100
FROM "apple_stand"."autogen"."variety"
WHERE time >= '2018-06-18T12:00:00Z' AND time <= '2018-06-19T04:35:00Z'
GROUP BY time(1h)
Note the following about this query:
- It uses aggregate functions (
mean()) for pulling all data. - It includes a
GROUP BY time()clause which aggregates data into 1 hour blocks. - It includes an explicitly limited time window. Without it, aggregate functions are very resource-intensive.
If visualized as a stacked graph in Chronograf, it would look like:

Was this page helpful?
Thank you for your feedback!
Support and feedback
Thank you for being part of our community! We welcome and encourage your feedback and bug reports for InfluxDB and this documentation. To find support, use the following resources:
Customers with an annual or support contract can contact InfluxData Support.
