
Get started with Telegraf Controller
After you’ve installed Telegraf Controller and set up your owner account, you’re ready to start managing Telegraf configurations and agents. This guide walks you through the core workflow: creating a configuration, starting a Telegraf agent using the configuration, and verifying that the agent reports back to Telegraf Controller.
- Create an API token
- Create a Telegraf configuration
- Start a Telegraf agent
- View the reporting agent
- Update the configuration
- Verify the configuration update
Create an API token
API tokens authenticate Telegraf agents when they retrieve configurations and send heartbeats to Telegraf Controller.
Navigate to the API Tokens page.
Click + Create API Token.
Enter a description–for example,
Getting started agent token.Select a token Expiration.
Select the permissions to assign to the token. For convenience, you can select one of the available Permission Presets.
The Telegraf Agent preset includes all permissions a Telegraf agent needs to interact with Telegraf Controller.
Telegraf agents need the following permissions to interact with Telegraf Controller:
- Configurations: Read
- Heartbeat: Write
Click Create Token.
Copy and store your token
Copy your API token immediately after creation. The full token value is only displayed once and cannot be retrieved later.
For more information about token permissions, see Manage API tokens.
Create a Telegraf configuration
Configurations define what data Telegraf collects, how it processes the data, and where it sends it. For this guide, you’ll create a simple configuration that prints a message to stdout and reports agent health back to Telegraf Controller.
In the Telegraf Controller user interface (UI), select Configurations in the navigation bar.
Click Add Config.
Enter a name and description for the configuration–for example, “Getting Started.”
In the Code Editor, enter the following TOML:
[[inputs.exec]] commands = [ ["echo", "Started with a config from Telegraf Controller"] ] data_format = "value" data_type = "string" [[outputs.file]] files = ["stdout"] data_format = "template" template = "{{ .Time.Format \"15:04:05\" }}: {{ .Field \"value\" }}\n" [[outputs.heartbeat]] url = "http://localhost:8000/agents/heartbeat" instance_id = "&{agent_id}" interval = "1m" include = ["hostname", "statistics", "configs", "status"] # Include to authorize with Telegraf Controller # Note: If using Telegraf 1.38.x or earlier, use INFLUX_TOKEN token = "${TELEGRAF_CONTROLLER_TOKEN}" [outputs.heartbeat.status] default = "ok"[[inputs.exec]] commands = [ ["cmd", "/C", "echo Started with a config from Telegraf Controller"] ] data_format = "value" data_type = "string" [[outputs.file]] files = ["stdout"] data_format = "template" template = "{{ .Time.Format \"15:04:05\" }}: {{ .Field \"value\" }}\n" [[outputs.heartbeat]] url = "http://localhost:8000/agents/heartbeat" instance_id = "&{agent_id}" interval = "1m" include = ["hostname", "statistics", "configs", "status"] # Include to authorize with Telegraf Controller # Note: If using Telegraf 1.38.x or earlier, use INFLUX_TOKEN token = "${TELEGRAF_CONTROLLER_TOKEN}" [outputs.heartbeat.status] default = "ok"This configuration does the following:
- Uses the
execinput plugin to execute anechocommand to output a message. - Uses the
fileoutput plugin to output the message tostdout, formatted using a template that includes a timestamp and the message. - Uses the heartbeat plugin to periodically send agent status information back to Telegraf Controller, which lets you monitor agent health, track which configurations are loaded, and detect when agents stop reporting.
- Uses the
TELEGRAF_CONTROLLER_TOKEN(Telegraf 1.39+) or theINFLUX_TOKEN(Telegraf 1.38.x or earlier) environment variable to authorize with Telegraf Controller. - Uses the
agent_idparameter to set theinstance_idwhich uniquely identifies the Telegraf agent.
Heartbeat URL and port
The example above uses
http://localhostand the default heartbeat port,8000. Your Telegraf Controller instance provides a default heartbeat configuration with the heartbeat URL and port for your instance.- Uses the
Click Create Configuration.
Start a Telegraf agent
With a configuration and token ready, start a Telegraf agent that pulls its configuration from Telegraf Controller and reports back via the heartbeat plugin.
Use the command builder
Telegraf Controller can build the telegraf command for you:
In Telegraf Controller, select Configurations in the navigation bar.
Click the name of the configuration you created.
Click Use this Configuration.
In the command builder modal:
- In the Environment Variables section, define the INFLUX_TOKEN environment variable using the raw token string of the API token you created. This authorizes the Telegraf agent to interact with Telegraf Controller.
- In the Parameters section, define the agent_id parameter with a unique agent identifier.
- In the Auto Update section, enable auto-update and set the interval
to
30s. This instructs Telegraf to check for configuration updates every 30 seconds.
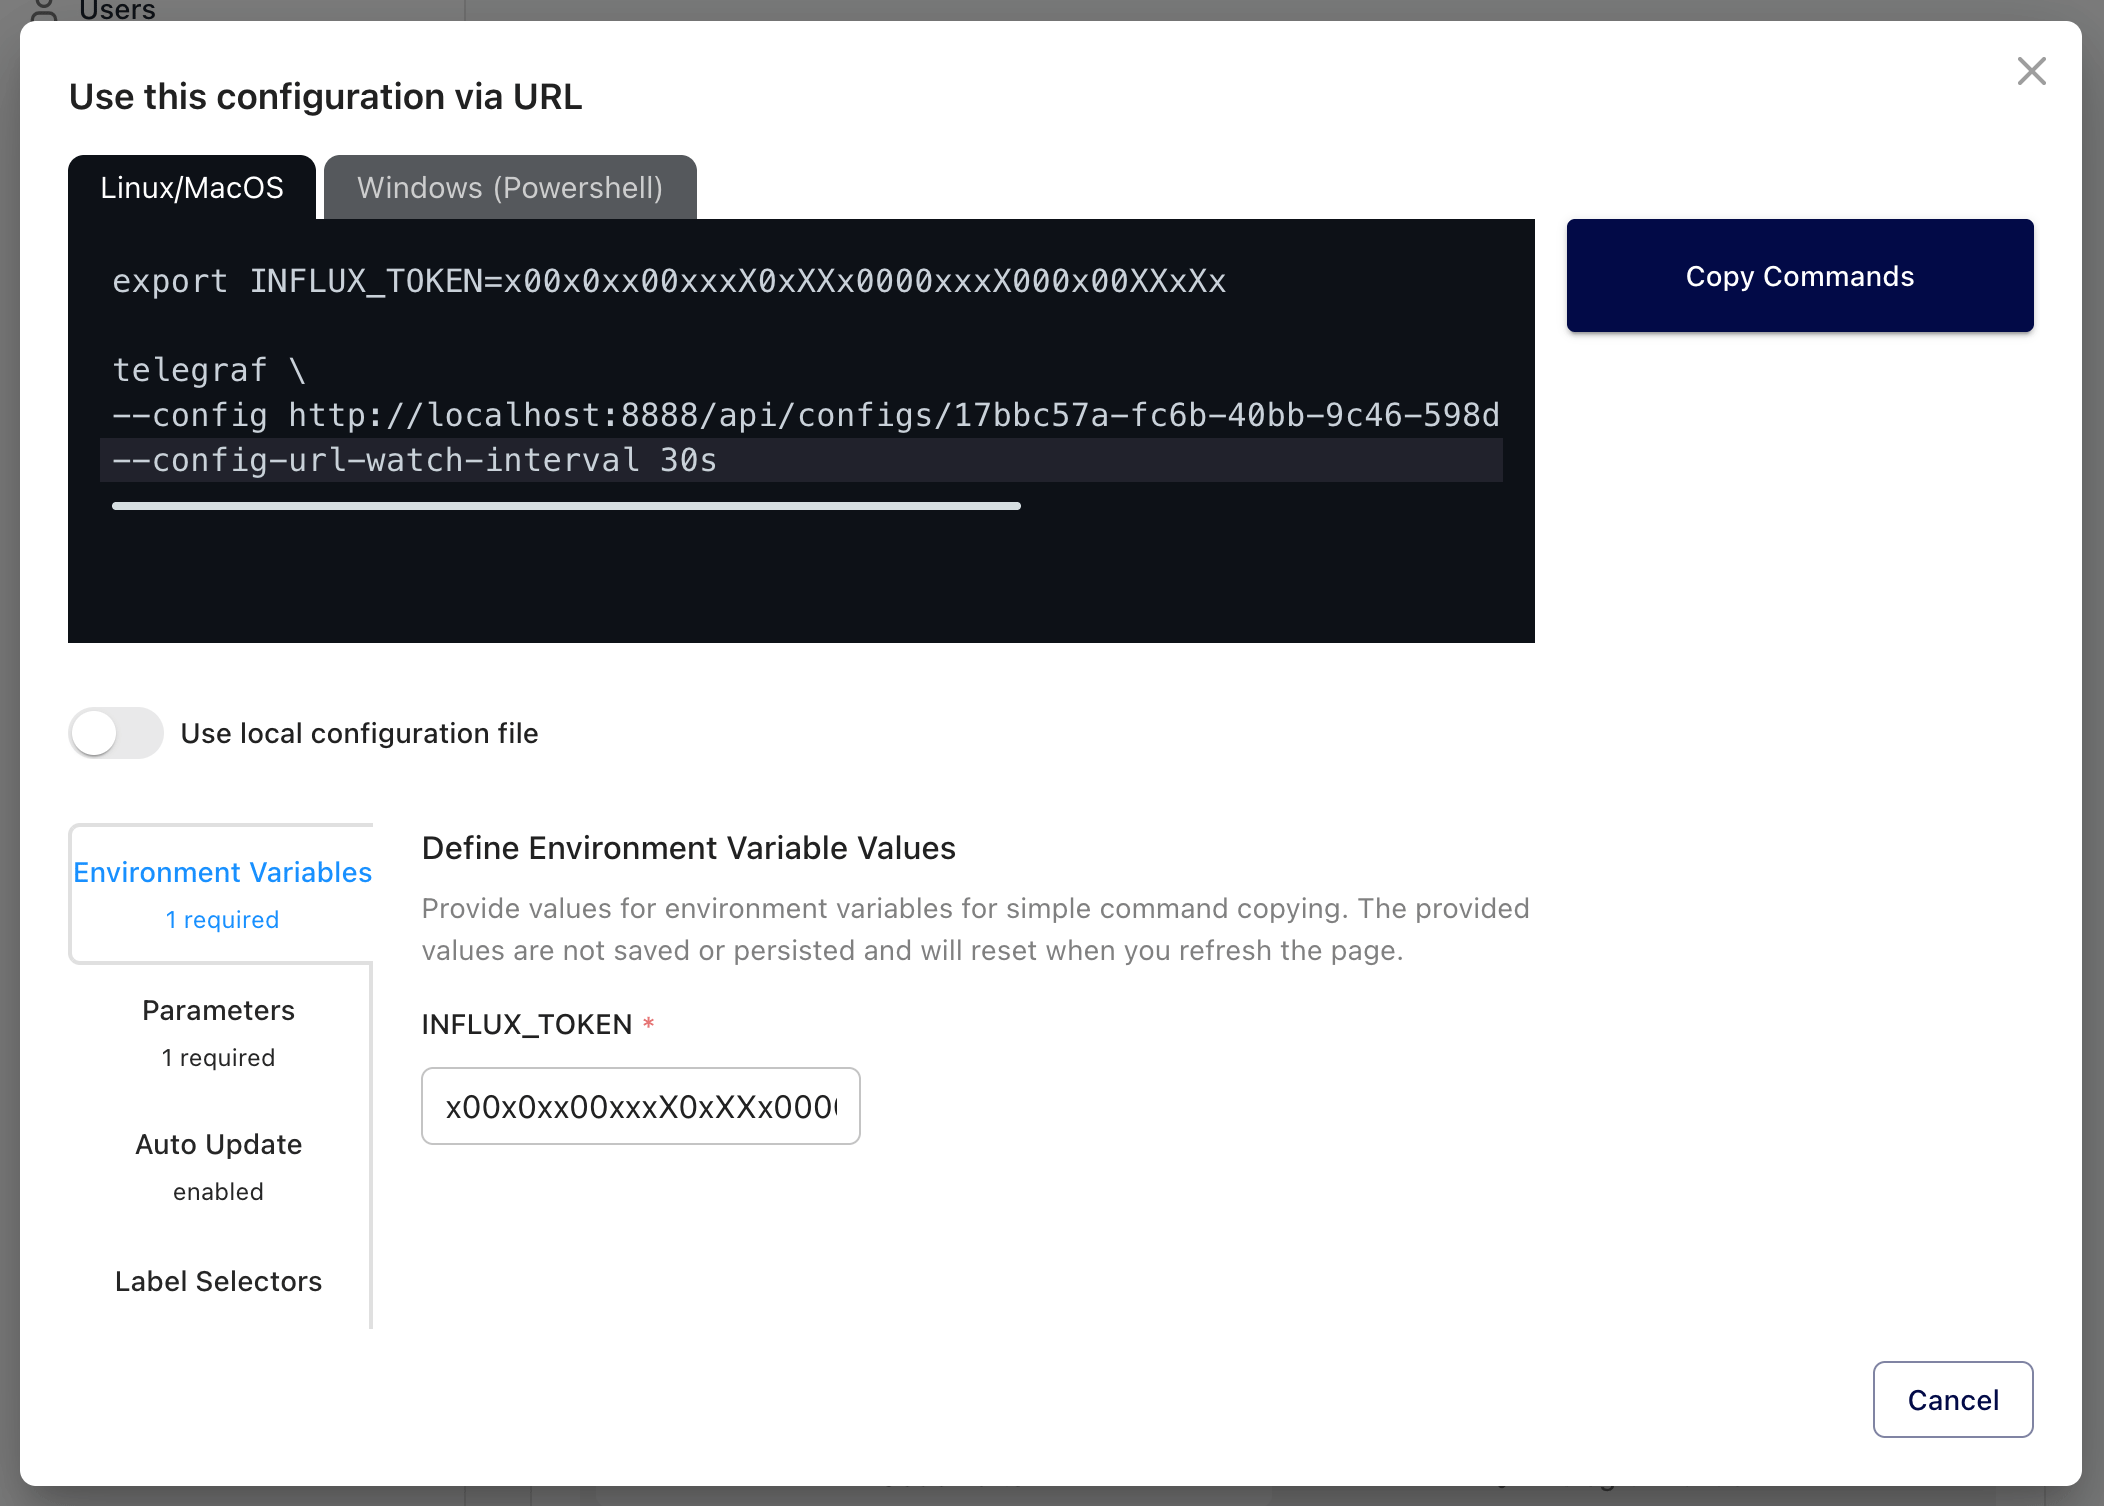
Click Copy Commands to copy the generated command to your clipboard.
Paste and run the command in your terminal.
Run manually
Alternatively, start the agent manually by running the following commands in your terminal. Replace the placeholder values with your actual Telegraf Controller URL and port, configuration ID, API token, and agent ID:
# Note: If using Telegraf 1.38.x or earlier, use INFLUX_TOKEN environment variable
export TELEGRAF_CONTROLLER_TOKEN=YOUR_TC_API_TOKEN

telegraf \
  --config "http://localhost:8888/api/configs/YOUR_CONFIG_ID/toml?agent_id=AGENT_ID" \
  --config-url-watch-interval 30s
# Note: If using Telegraf 1.38.x or earlier, use INFLUX_TOKEN environment variable
$env:TELEGRAF_CONTROLLER_TOKEN="YOUR_TC_API_TOKEN"
telegraf.exe `
--config "http://localhost:8888/api/configs/YOUR_CONFIG_ID/toml?agent_id=AGENT_ID" `
--config-url-watch-interval 30sReplace the following:
YOUR_TC_API_TOKEN: API token you created in the previous stepYOUR_CONFIG_ID: Configuration ID from your configuration’s detail page in Telegraf ControllerAGENT_ID: A unique ID for your Telegraf agent
The TELEGRAF_CONTROLLER_TOKEN (Telegraf 1.39+) or the INFLUX_TOKEN
(Telegraf 1.38.x or earlier) environment variables authorize the agent to
retrieve the configuration and send heartbeats to Telegraf Controller.
The --config-url-watch-interval flag tells Telegraf to check for configuration
updates at the specified interval.
In this example, the agent checks every 30 seconds and automatically reloads the
configuration if it has changed.
After starting, Telegraf retrieves the configuration from Telegraf Controller and begins collecting metrics. You should see the timestamp and message printed to stdout.
View the reporting agent
Once the agent sends its first heartbeat (within about one minute), it appears in Telegraf Controller.
- In Telegraf Controller, select Agents in the navigation bar.
- Confirm your agent appears in the list with an Ok status.
- Click the More button (⋮) and select View Details to see agent metadata, the loaded configuration, and reporting history.
Update the configuration
To see how configuration changes propagate to running agents, update the
message generated by the exec input plugin.
In Telegraf Controller, select Configurations in the navigation bar.
Click the name of the configuration you created.
Update the
echocommand to print a different message:[[inputs.exec]] commands = [ ["echo", "Started with AN UPDATED config from Telegraf Controller"] ] # ...[[inputs.exec]] commands = [ ["cmd", "/C", "echo Started with AN UPDATED config from Telegraf Controller"] ] # ...Click Save.
Verify the configuration update
Because you started Telegraf with --config-url-watch-interval 30s, the agent
checks for configuration updates every 30 seconds.
After you update the configuration in Telegraf Controller, the agent detects
the change on its next check interval and automatically reloads.
Watch the terminal where Telegraf is running.
Within 30 seconds, the message returned in the stdout output updates to the
new message, confirming that the agent picked up the updated configuration.
Next steps
- Create and manage configurations to define more advanced Telegraf pipelines.
- Use dynamic values to keep configurations portable across environments.
- Set up reporting rules to define when agents are considered not reporting.
- Configure agent statuses to monitor agent health using CEL expressions.
- Manage API tokens to control access to Telegraf Controller APIs.
Was this page helpful?
Thank you for your feedback!
Support and feedback
Thank you for being part of our community! We welcome and encourage your feedback and bug reports for Telegraf and this documentation. To find support, use the following resources:
Customers with an annual or support contract can contact InfluxData Support.