
Enable and configure audit logging
Enable audit logging in Telegraf Controller at startup, change the retention period as needed, and optionally forward events to external destinations for long-term storage or SIEM integration.
Available with Telegraf Enterprise
Audit logging is only available with Telegraf Enterprise. If you are interested in learning more about Telegraf Enterprise, contact us.
Prerequisites
- A valid Telegraf Enterprise license applied to your Telegraf Controller instance.
- Permission to modify the Telegraf Controller startup environment (for example, the systemd unit file or startup environment).
- The Owner or Administrator role to change the retention period from the UI.
Audit-logging state changes only at startup
Per Telegraf Controller’s security policy, settings that change the application’s security boundary, including whether audit logging is enabled and where audit events are forwarded, can only be changed at startup. Retention is the only audit setting that can be modified at runtime.
Enable audit logging
Set AUDIT_ENABLED to true before starting Telegraf Controller.
Add AUDIT_ENABLED=true to your systemd unit file (typically
/etc/systemd/system/telegraf-controller.service):
[Service]
Environment=AUDIT_ENABLED=true
Reload systemd and restart the service:
sudo systemctl daemon-reload
sudo systemctl restart telegraf-controller
Set the variable, or pass --audit-enabled on the command line:
export AUDIT_ENABLED=true
telegraf_controller --no-interactive
telegraf_controller --audit-enabled --no-interactiveSet the variable in PowerShell, or pass --audit-enabled on the command line:
$env:AUDIT_ENABLED="true"
./telegraf_controller.exe --no-interactive./telegraf_controller.exe --audit-enabled --no-interactiveAfter Telegraf Controller starts:
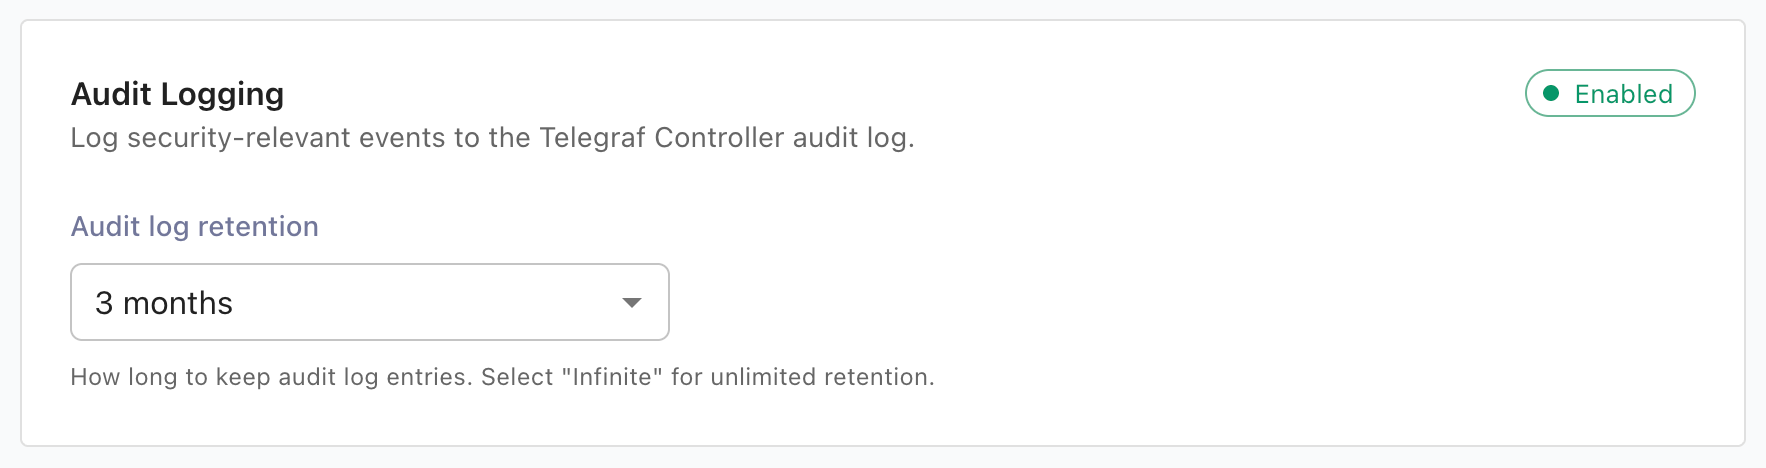
- The Settings > Audit Logging section displays as enabled.
- Audit entries begin appearing in the platform data directory described in Where audit logs are stored.
Configure retention
Telegraf Controller keeps audit entries for 90 days (2160 hours) by default and runs a cleanup job every 12 hours that removes entries older than the retention threshold.
Available retention values:
| Value | Hours |
|---|---|
| 30 days | 720 |
| 3 months | 2160 |
| 6 months | 4320 |
| 1 year | 8760 |
| 2 years | 17520 |
| Infinite | 0 |
Change audit log retention from the Settings page
- Sign in as an Owner or Administrator.
- Navigate to the Settings page from the left navigation menu.
- In the Audit Logging section, select a value from Audit log retention.
- Click Save.
The new retention value takes effect immediately. The next cleanup run removes any entries that fall outside the new window.
Set the initial retention at startup
Use the AUDIT_LOG_RETENTION environment variable to seed the retention
period when Telegraf Controller initializes its settings on first startup.
export AUDIT_LOG_RETENTION=8760AUDIT_LOG_RETENTION only sets the initial value.
After first startup, the database is authoritative.
To update audit log retention, use the Settings page.
Forward audit events
Telegraf Controller can forward each audit event to one or more external destinations in addition to writing it to local storage. Forwarders are configured at startup only and run independently, which lets you enable any combination of syslog, webhook, and file forwarders.
Forward to syslog
Forward audit events to a syslog server over TCP or UDP.
export AUDIT_SYSLOG_HOST=syslog.example.com
export AUDIT_SYSLOG_PORT=514
export AUDIT_SYSLOG_PROTOCOL=tcp| Variable | Description | Required |
|---|---|---|
AUDIT_SYSLOG_HOST | Syslog server hostname or IP | Yes |
AUDIT_SYSLOG_PORT | Syslog server port | Yes |
AUDIT_SYSLOG_PROTOCOL | Transport protocol: tcp or udp | Yes |
Forward to a webhook
Forward audit events as JSON POST requests to an HTTP webhook.
export AUDIT_WEBHOOK_URL=https://siem.example.com/ingest
export AUDIT_WEBHOOK_AUTH_HEADER="Bearer xxxxxxxxxxxx"| Variable | Description | Required |
|---|---|---|
AUDIT_WEBHOOK_URL | Full URL the webhook receives POST requests at | Yes |
AUDIT_WEBHOOK_AUTH_HEADER | Optional value sent in the Authorization HTTP header | No |
The webhook forwarder retries each event up to three times with backoff and a
10-second request timeout.
Events that return 408, 429, or 5xx responses are retried; events that
return other 4xx responses are dropped.
Telegraf Controller honors a Retry-After response header when present.
Append to a file
Append each event to a file as a single JSON object per line (.jsonl).
export AUDIT_FILE_PATH=/var/log/telegraf-controller/audit.jsonlThe path must be writable by the Telegraf Controller process.
Telegraf Controller does not rotate or trim this file. Pair it with a
system log rotator (such as logrotate) if you keep the forwarder on long
term.
Disable audit logging
To turn audit logging off, remove AUDIT_ENABLED (or set it to a value
other than true) and restart Telegraf Controller.
The startup-only policy applies in both directions: audit logging cannot be
disabled from the UI.
Existing audit files remain on disk and continue to be readable through
GET /api/audit-logger until they
age out of retention.
Was this page helpful?
Thank you for your feedback!
Support and feedback
Thank you for being part of our community! We welcome and encourage your feedback and bug reports for Telegraf and this documentation. To find support, use the following resources:
Customers with an annual or support contract can contact InfluxData Support.