
Use Grafana to query and visualize data
Use Grafana or Grafana Cloud to query and visualize data from InfluxDB Clustered.
Identify your InfluxDB version
If you are unsure which InfluxDB product you are using, use our interactive version detector to help identify it:
[Grafana] enables you to query, visualize, alert on, and explore your metrics, logs, and traces wherever they are stored. [Grafana] provides you with tools to turn your time-series database (TSDB) data into insightful graphs and visualizations.
- Install Grafana or log in to Grafana Cloud
- InfluxDB data source
- Before you begin
- Create an InfluxDB data source
- Query and visualize data
Install Grafana or log in to Grafana Cloud
Sign up for Grafana Cloud or follow the Grafana installation instructions to install Grafana for your operating system.
If running Grafana locally, enable the
newInfluxDSConfigPageDesignfeature flag to use the latest InfluxDB data source plugin.For more information, see Configure feature toggles in the Grafana documentation.
Visit your Grafana Cloud user interface (UI) or, if running Grafana locally, start Grafana and visit http://localhost:3000 in your browser.
Using Grafana Cloud with a local InfluxDB instance
If you need to keep your database local, consider running Grafana locally instead of using Grafana Cloud, as this avoids the need to expose your database to the internet.
To use InfluxDB running on your private network with Grafana Cloud, you must configure a private data source for Grafana Cloud.
InfluxDB data source
The InfluxDB data source plugin is included in the Grafana core distribution. Use the plugin to query and visualize data from InfluxDB Clustered with both SQL and InfluxQL.
Grafana 12.2+
The instructions below are for Grafana 12.2+ with the newInfluxDSConfigPageDesign
feature flag enabled. This introduces the newest version of the InfluxDB core plugin.
The updated plugin includes SQL support for InfluxDB 3-based products such
as InfluxDB Clustered, and the interface dynamically adapts based on your
product and query language selection in URL and authentication.
Before you begin
Prerequisites:
- Grafana 12.2 or later
- Administrator role in Grafana
A database token with read access to the database
Quick reference: InfluxDB Clustered configuration
| Configuration | Value |
|---|---|
| Product selection | InfluxDB Clustered |
| | URL | Cluster URL
–for example, https://cluster-host.com
|
| Query languages | SQL (requires HTTP/2), InfluxQL |
| Authentication |
Required (database token) | | Database/Bucket | Database name |
Create an InfluxDB data source
- In your Grafana interface, click Connections in the left sidebar.
- Click Data sources.
- Click Add new data source.
- Search for and select InfluxDB. The InfluxDB data source configuration page displays.
- In the Settings tab, enter a Name for your data source.
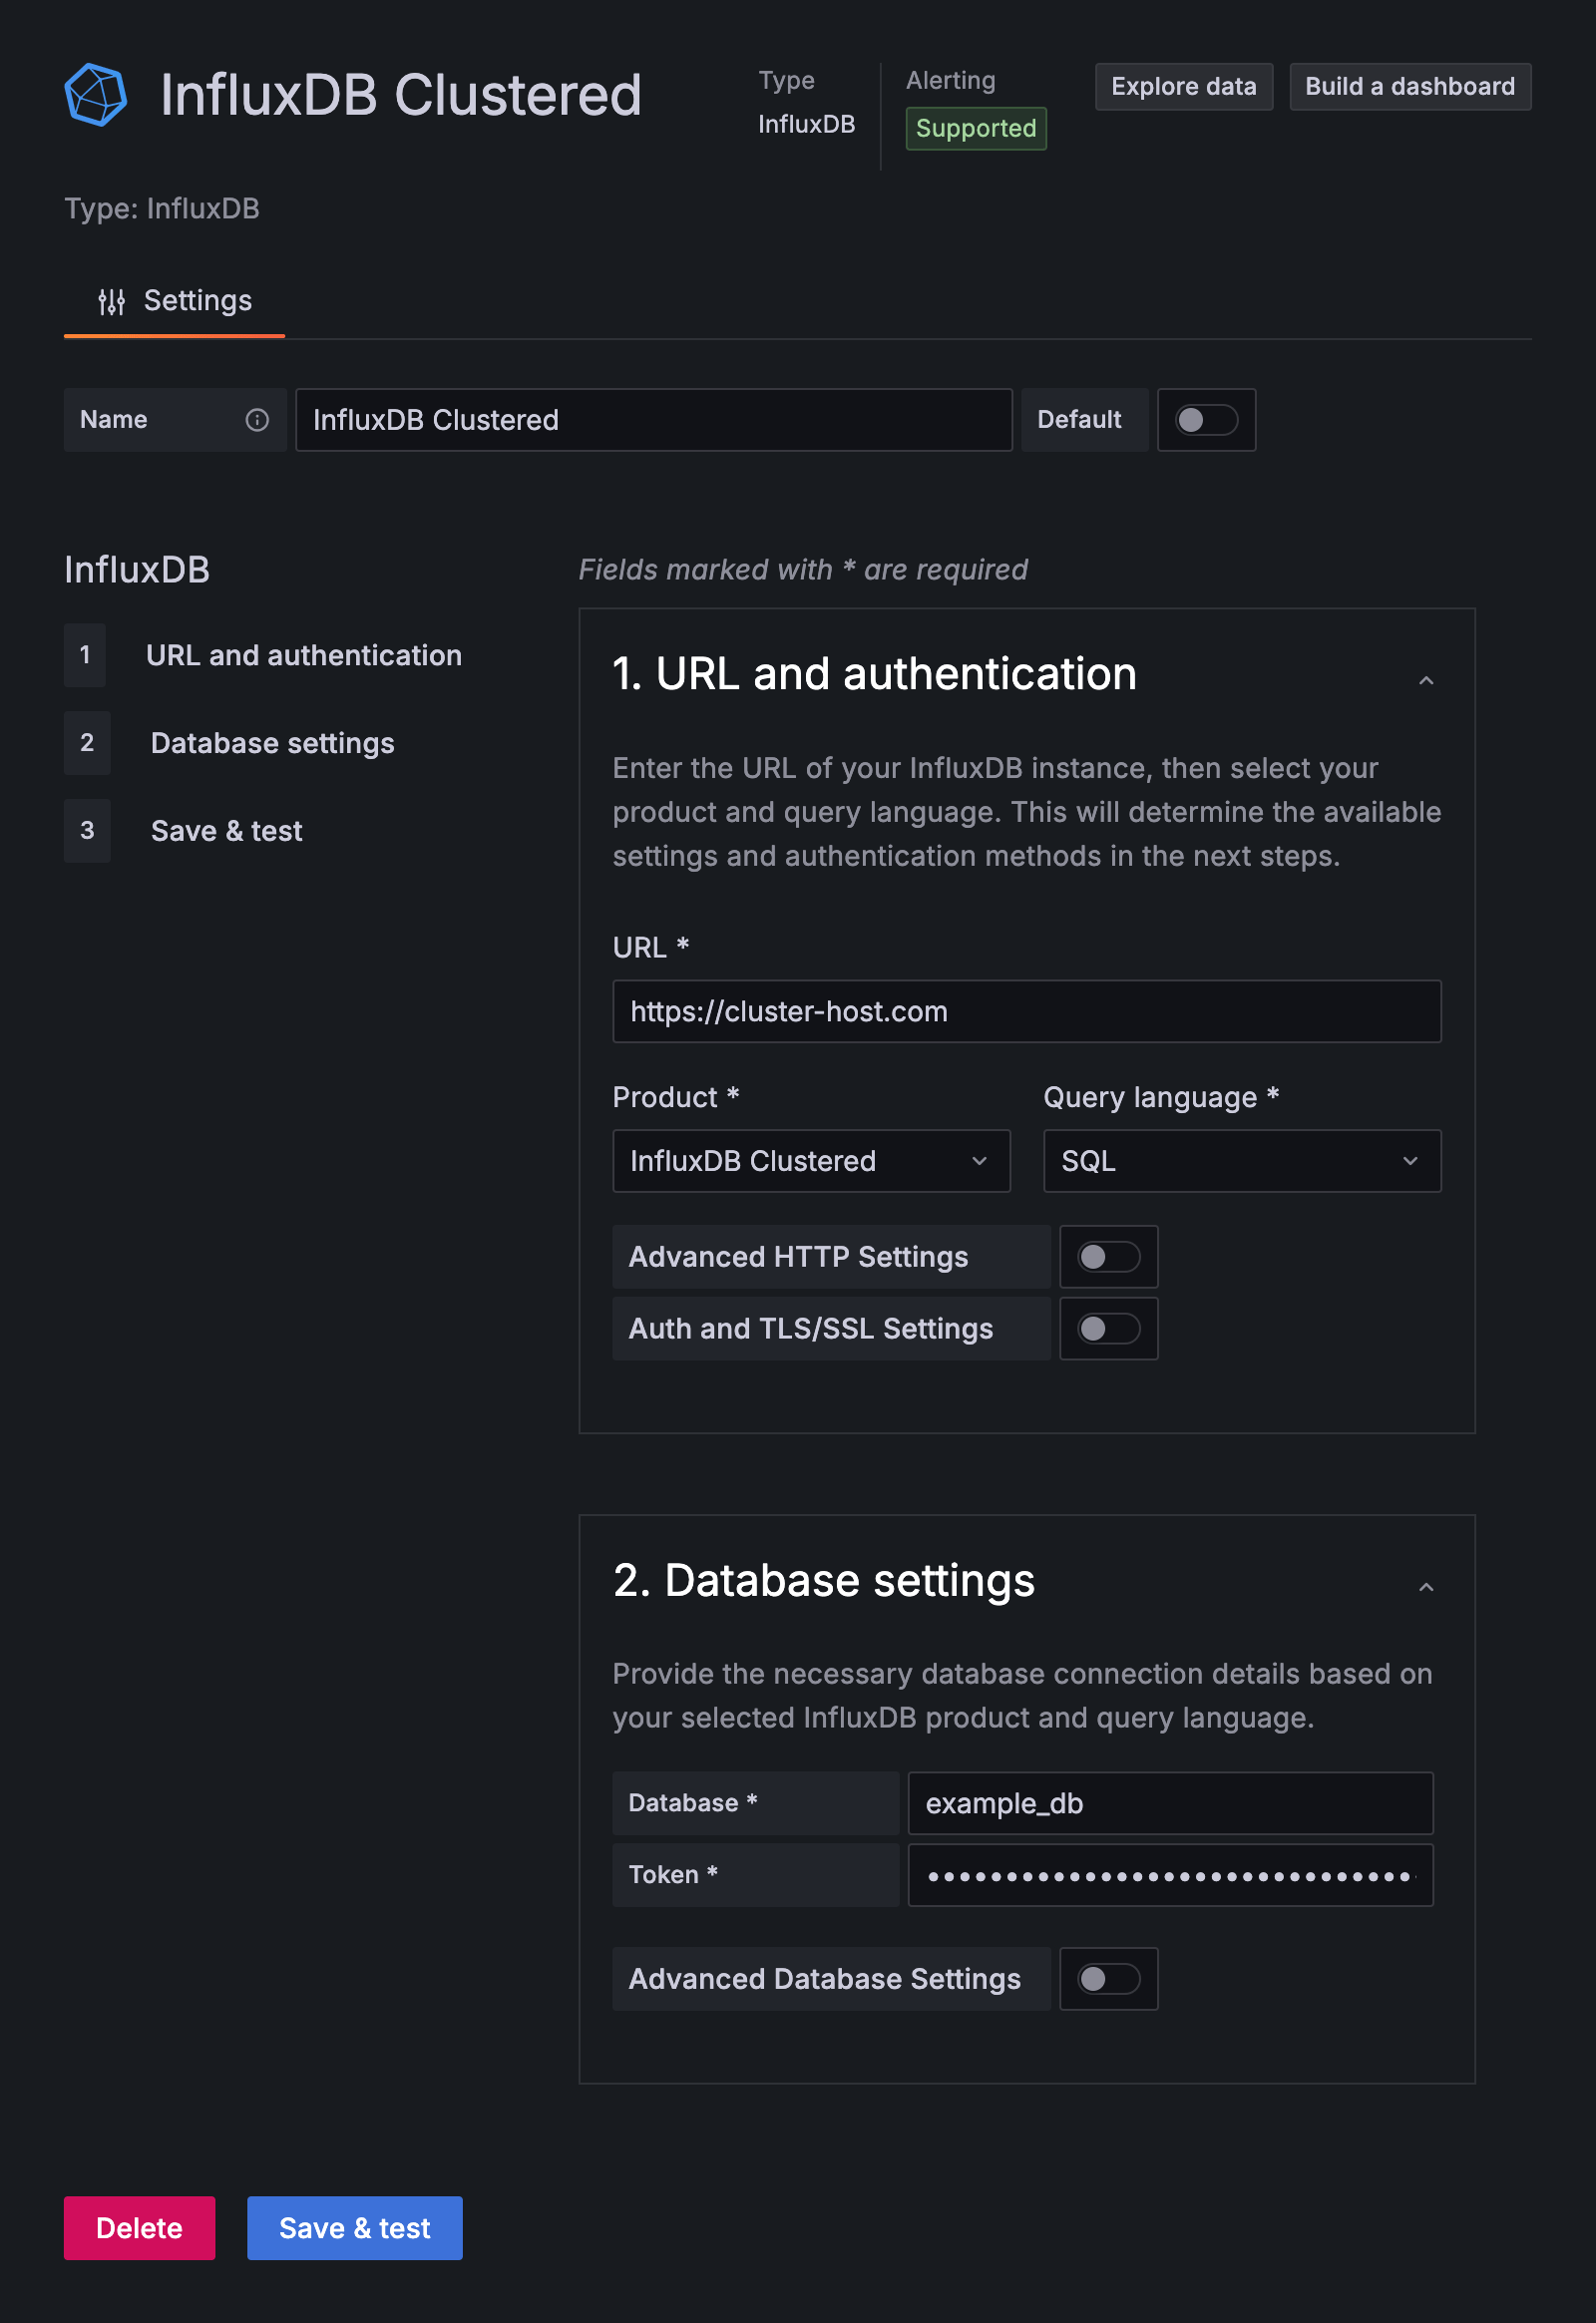
Configure URL and authentication
In the URL and authentication section, configure the following:
- URL: Your InfluxDB Clustered cluster URL
–for example, https://cluster-host.com
Product: From the dropdown, select InfluxDB Clustered
Query Language: Select SQL or InfluxQL
(Optional) Advanced HTTP Settings, Auth, and TLS/SSL Settings as needed for your environment
Configure database settings
The fields in this section change based on your query language selection in URL and authentication.
SQL configuration
When you select SQL as the query language, configure the following fields:
Database: Your database name.
Token: A database token with read access to the database
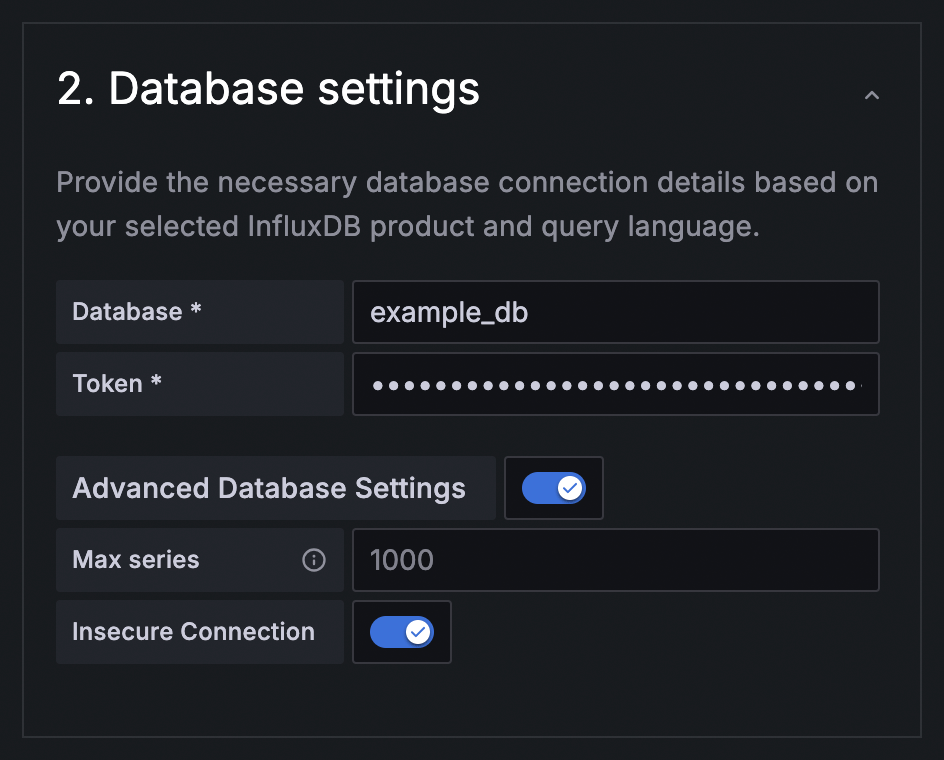
Use SQL without TLS/SSL
If using SQL to query InfluxDB Clustered without TLS/SSL, enable the Insecure Connection option in your InfluxDB datasource configuration:
- Under Database settings, enable Advanced Database Settings.
- Enable Insecure Connection.
Grafana queries through a proxy require HTTP/2
For SQL queries, Grafana uses the Flight SQL protocol (gRPC) to query InfluxDB Clustered, which requires HTTP/2. If you query InfluxDB Clustered through a proxy (such as HAProxy, nginx, or a load balancer), verify that your proxy is configured to support HTTP/2. Without HTTP/2 support, SQL queries through Grafana will fail to connect.
InfluxQL queries use HTTP/1.1 and are not affected by this requirement.
Click Save & test. Grafana attempts to connect to InfluxDB Clustered and returns the result of the test.
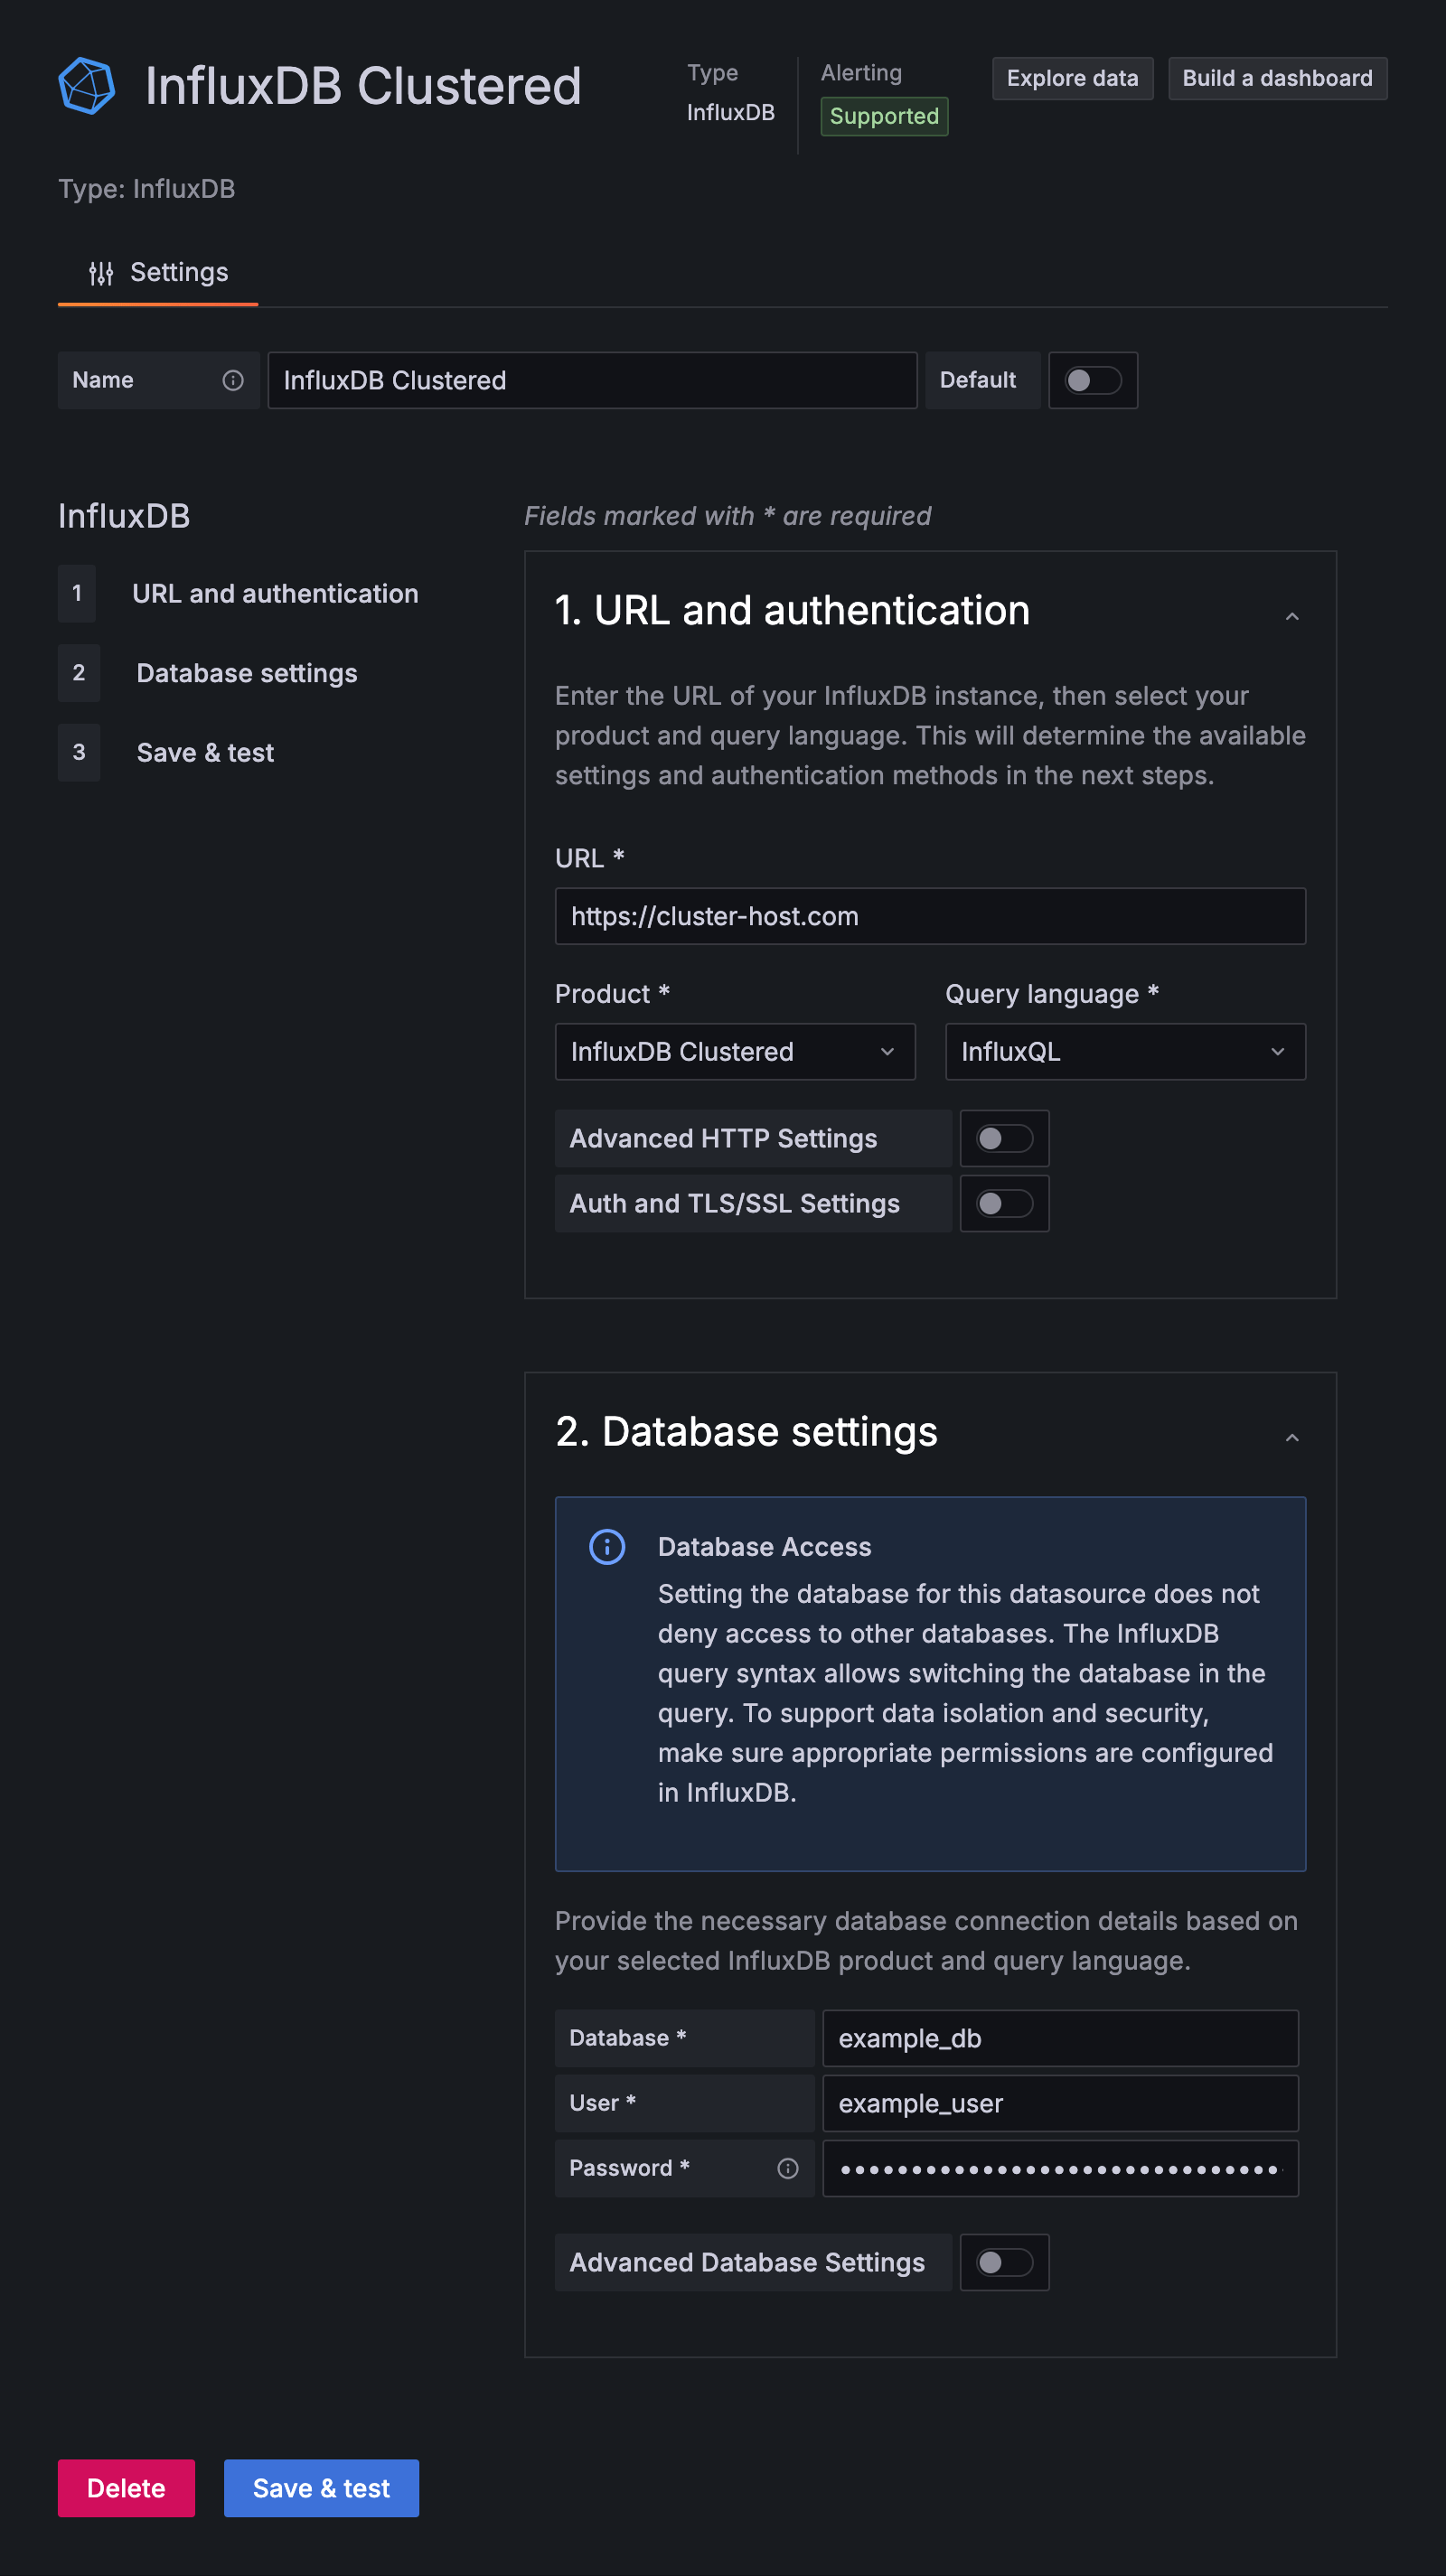
InfluxQL configuration
When you select InfluxQL as the query language, configure the following fields:
Database: Your database name.
User: A username (can be any non-empty value).
Password: Your database token with read access to the database.
HTTP Method: Select POST (recommended) or GET
Click Save & test. Grafana attempts to connect to InfluxDB Clustered and returns the result of the test.
Query and visualize data
With your InfluxDB connection configured, use Grafana to query and visualize time series data.
Query InfluxDB with Grafana
After you configure and save an InfluxDB datasource, use Grafana to build, run, and inspect queries against InfluxDB Clustered .
When working with the InfluxDB Clustered SQL implementation a bucket is equivalent to a database, a measurement is equivalent to a table, and time, fields, and tags are structured as columns.
To learn more, see Query Data.
Click Explore.
In the dropdown, select the saved InfluxDB data source to query.
Use the SQL query form to build your query:
Table: Select the table (measurement) to query.
Column: Select one or more fields and tags to return as columns in query results.
With SQL, select the
timecolumn to include timestamps with the data. Grafana relies on thetimecolumn to correctly graph time series data.Optional: Toggle filter to generate WHERE clause statements.
- WHERE: Configure condition expressions to include in the
WHEREclause.
- WHERE: Configure condition expressions to include in the
Optional: Toggle group to generate GROUP BY clause statements.
- GROUP BY: Select columns to group by. If you include an aggregation function in the SELECT list, you must group by one or more of the queried columns. SQL returns the aggregation for each group.
Recommended: Toggle order to generate ORDER BY clause statements.
- ORDER BY: Select columns to sort by. You can sort by time and multiple fields or tags. To sort in descending order, select DESC.
Recommended: Change format to Time series.
- Use the Format dropdown to change the format of the query results. For example, to visualize the query results as a time series, select Time series.
Click Run query to execute the query.
- Click Explore.
- In the dropdown, select the InfluxDB data source that you want to query.
- Use the InfluxQL query form to build your query:
- FROM: Select the measurement that you want to query.
- WHERE: To filter the query results, enter a conditional expression.
- SELECT: Select fields to query and an aggregate function to apply to each.
The aggregate function is applied to each time interval defined in the
GROUP BYclause. - GROUP BY: By default, Grafana groups data by time to downsample results and improve query performance. You can also add other tags to group by.
- Click Run query to execute the query.
With your InfluxDB connection configured, use Grafana to query and visualize time series data.
Build visualizations with Grafana
For a comprehensive walk-through of creating visualizations with Grafana, see the Grafana documentation.
Query inspection in Grafana
To learn more about query management and inspection in Grafana, see the Grafana Explore documentation.
Was this page helpful?
Thank you for your feedback!
Support and feedback
Thank you for being part of our community! We welcome and encourage your feedback and bug reports for InfluxDB Clustered and this documentation. To find support, use the following resources:
Customers with an annual or support contract can contact InfluxData Support.