
Monitor your instance
Use the instance Overview page in the InfluxDB 3 Cloud Admin UI to monitor the health, size, and usage of your instance. The page shows instance details, the compute resources allocated to each component, CPU and memory metrics, ingest and query rates, storage used, and object storage request counts.
- Open the Overview page
- View instance details
- View instance size
- View instance metrics
- View storage and usage
- Backups
Open the Overview page
- Go to console.influxdata.com and sign in.
- Select your instance.
- In the navigation, select Overview.
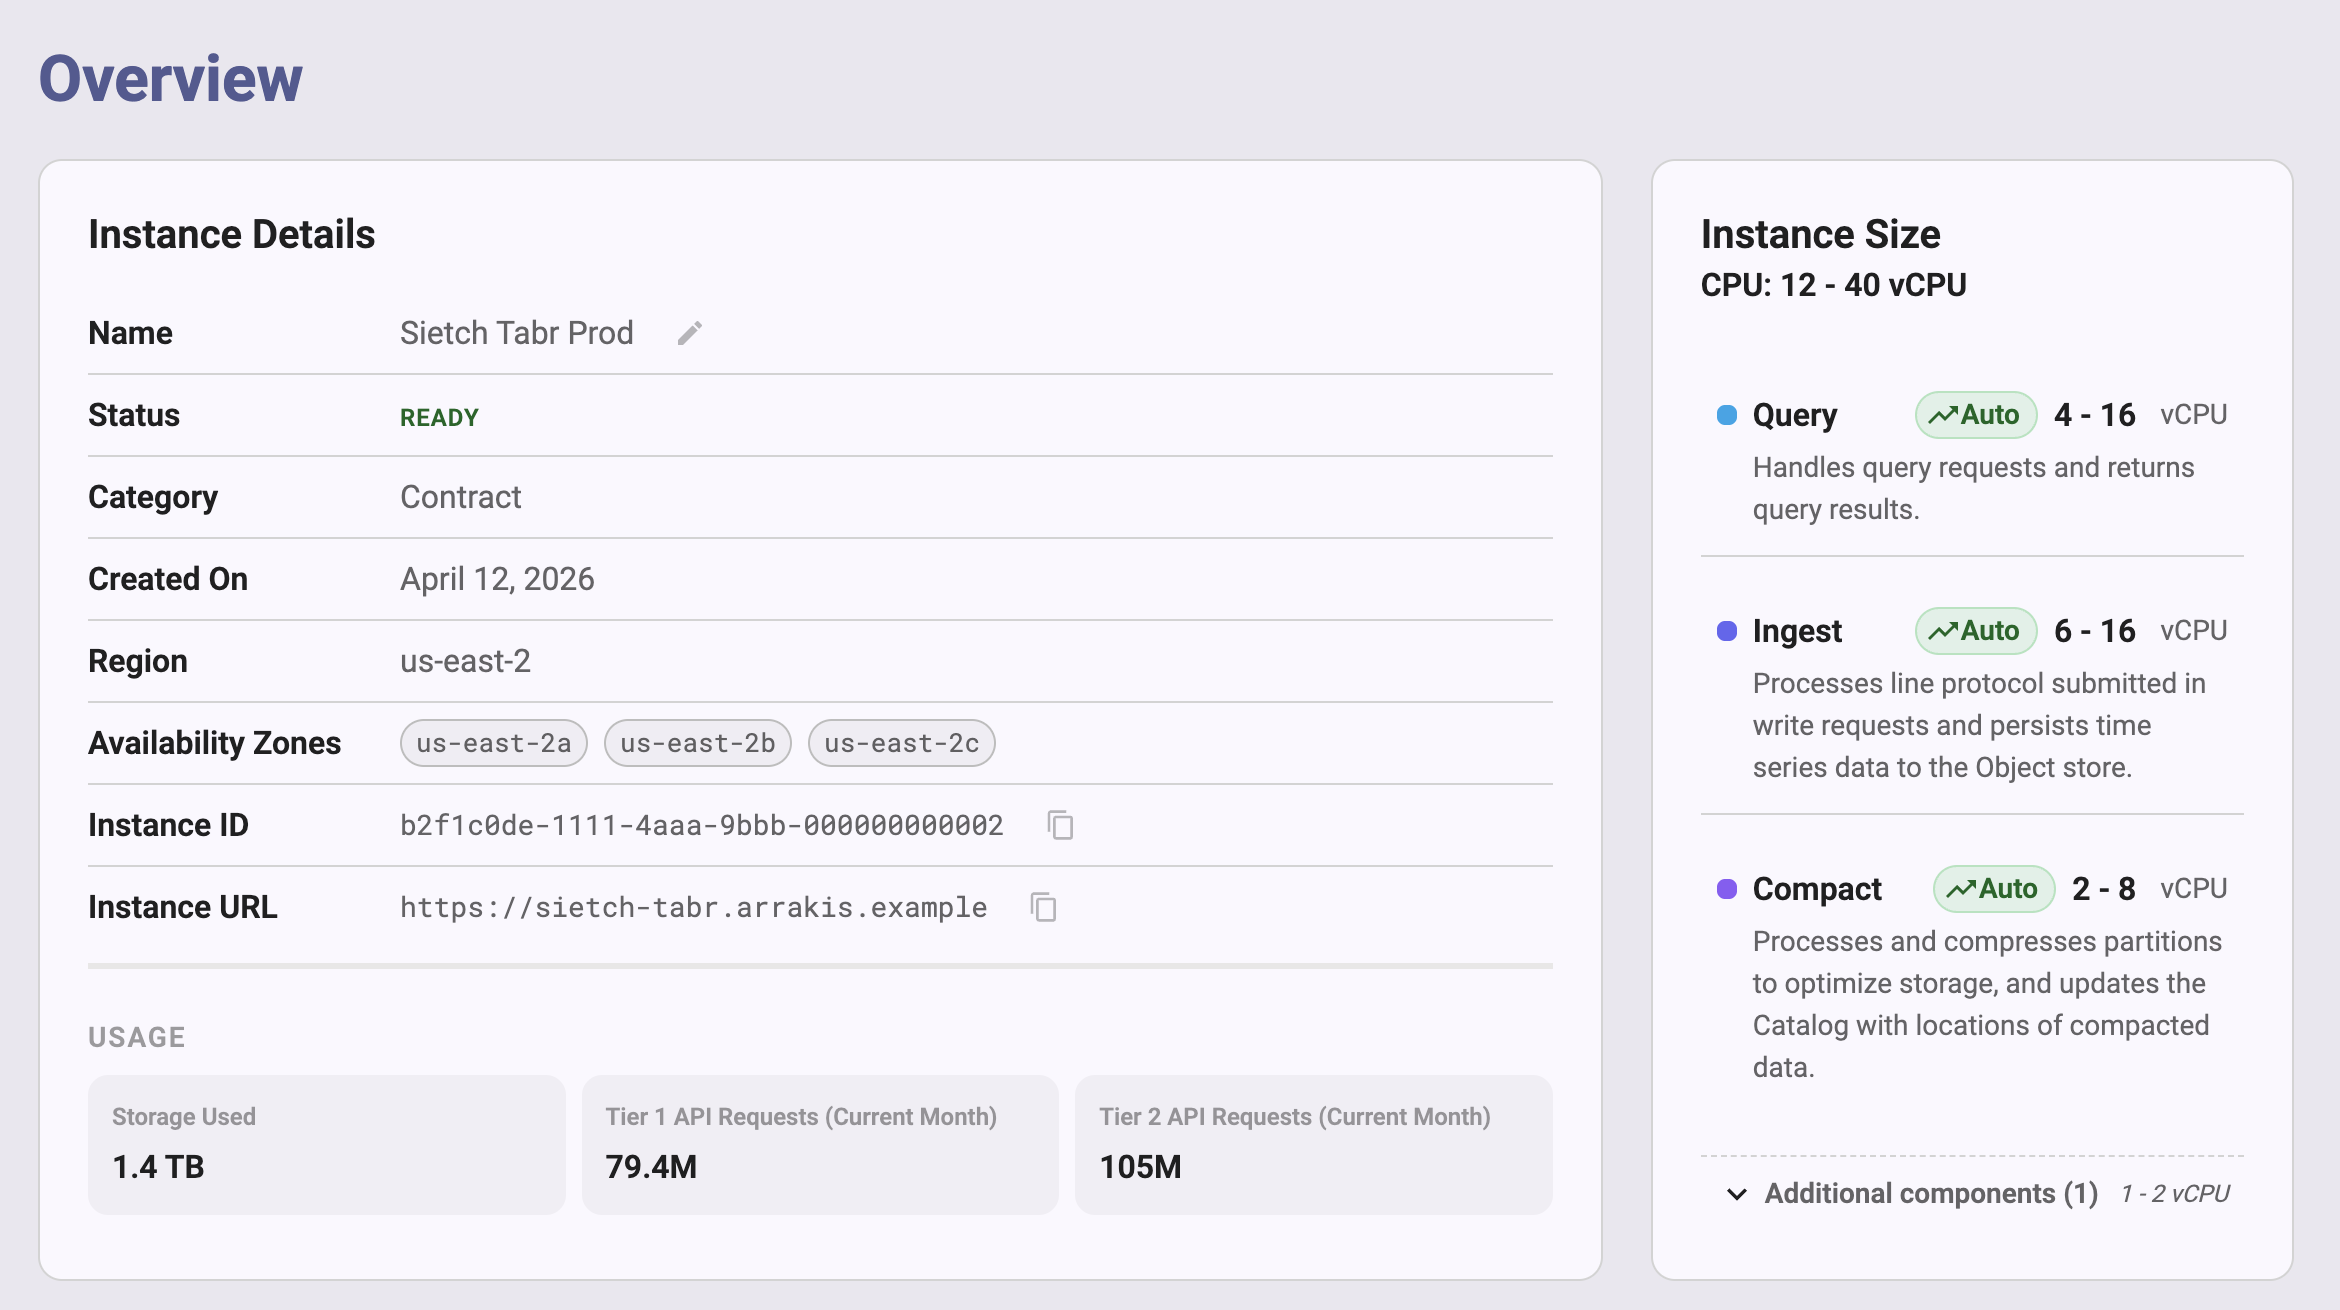
Users with the account Admin, Member, or Auditor role can view the Overview page. If you don’t have access to an instance, ask an account Admin to update your roles.
View instance details
The Instance Details card lists the following properties:
- Name: The instance name. To rename the instance, click the pencil icon next to the name, enter a new name, and then save it. Renaming an instance requires the account Admin role.
- Status: The instance state.
The Admin UI displays one of the following:
- Starting: The instance is starting up.
- Ready: The instance is running.
- Pending deletion: The instance is scheduled for deletion.
- Deleted: The instance is deleted.
- Category: The instance category, such as Contract or POC.
- Created On: The date the instance was created.
- Region: The cloud provider region where the instance runs.
- Availability Zones: The availability zones that the instance uses.
- Instance ID: The unique identifier of the instance. Click the copy icon to copy it.
- Instance URL: The URL of the instance. Click the copy icon to copy it. Use this URL as the host when you write or query data.
If usage data is available for the instance, the card also shows a Usage section with the following tiles for the current month:
- Storage Used: The amount of object storage that the instance uses.
- Tier 1 API Requests (Current Month): The number of tier 1 object storage requests.
- Tier 2 API Requests (Current Month): The number of tier 2 object storage requests.
A tile displays an em dash (—) when no value is available.
Tier 1 and tier 2 counts are object storage requests
The Tier 1 API Requests and Tier 2 API Requests tiles, and the API Calls chart described in View storage and usage, count requests that your instance makes to the cloud provider’s object storage service, such as Amazon S3 or Azure Blob Storage. They don’t count InfluxDB HTTP API calls, such as the write or query requests that your applications send to the instance. To monitor write and query request rates, use the Ingest Request Rate and Query Request Rate charts.
View instance size
The Instance Size card shows the total CPU allocated to the instance, in vCPUs, and the CPU allocated to each component. For a component that scales automatically, the card shows an Auto label and the component’s vCPU range, and the total is shown as a range.
The card lists the following components:
- Ingest: Processes line protocol submitted in write requests and persists time series data to object storage.
- Query: Handles query requests and returns query results.
- Compaction: Processes and compresses partitions to optimize storage, and updates the catalog with the locations of compacted data.
The card lists components that run scheduled tasks, such as the processing engine, under Additional components. Click Additional components to expand the list. If the card can’t retrieve component information, it displays “Component information is currently unavailable.”
The Instance Size card is read-only. To change the size of your instance, contact InfluxData support.
View instance metrics
The Instance Metrics panel charts CPU, memory, and request metrics for the instance and for each component.
Change the time range
By default, the charts show the last hour. Use the time range menu in the upper right of the panel to change the range:
- Under Quick ranges, select Last Minute, Last 5 Minutes, Last 30 Minutes, Last Hour, Last 12 Hours, Last Day, or Last Month.
- Under Absolute range, enter From and To times. Metrics are available for the last 30 days.
To refresh the charts automatically, turn on Live Updates. Live updates are available only for ranges of one hour or less.
Chart reference
The panel groups charts by category. CPU is measured in vCPUs, and memory is shown as a percentage of the memory allocated.
| Group | Chart | Unit |
|---|---|---|
| Instance Totals | CPU Usage | vCPUs |
| Instance Totals | Memory Usage | Usage % |
| Ingest | Ingest CPU | vCPUs |
| Ingest | Ingest Memory | Usage % |
| Ingest | Ingest Line Protocol Rate | Lines/sec |
| Ingest | Ingest Bytes Rate | MB/s |
| Ingest | Ingest Request Rate | Requests/sec |
| Query | Query CPU | vCPUs |
| Query | Query Memory | Usage % |
| Query | Query Request Rate | Requests/sec |
| Compaction | Compaction CPU | vCPUs |
| Compaction | Compaction Memory | Usage % |
Use the charts
Use the charts to understand how your workload uses the instance:
- Instance Totals: Compare CPU Usage with the total vCPUs on the Instance Size card to see how much headroom the instance has.
- Ingest charts: Track write volume. Ingest Line Protocol Rate shows lines written per second, Ingest Bytes Rate shows the volume of data written, and Ingest Request Rate shows the number of write requests per second. Use these charts to confirm that a change in your writers, such as a new Telegraf agent or a larger batch size, has the effect that you expect.
- Query charts: Track read load. Query Request Rate shows the number of query requests per second. Compare it with Query CPU and Query Memory to find periods when queries drive resource use.
- Compaction charts: Track background work that optimizes stored data. Brief increases in Compaction CPU after heavy writes are normal. If Compaction CPU or Compaction Memory stays high for a sustained period, compaction might not be keeping up with your write volume. Compare the chart with the ingest charts to see whether a rise in write volume matches the increase, and contact InfluxData support if the usage doesn’t return to normal.
View storage and usage
The Storage & Usage section charts the following over time:
- Storage used by data files
- Object storage request counts
Each chart has its own time range menu with the following options: 1 Week, 30 Days, 60 Days, 90 Days, and 1 Year. The default is 30 Days.
- Total Instance File Size: The total storage used by the instance’s data files.
- API Calls: A bar chart of the number of requests the instance makes to object storage, with a series for Tier 1 and a series for Tier 2. Turn on Show Total to add a series with their combined count. These counts exclude InfluxDB HTTP API requests, such as write and query requests.
Backups
The Overview page also includes a Backups card for managing instance backups.
Was this page helpful?
Thank you for your feedback!
Support and feedback
Thank you for being part of our community! We welcome and encourage your feedback and bug reports for InfluxDB 3 Cloud and this documentation. To find support, use the following resources:
Customers with an annual or support contract can contact InfluxData Support.