
View the query log
The query log records queries executed on your InfluxDB Cloud Dedicated cluster. Use it to monitor query performance, find slow-running queries, and troubleshoot failed executions.
Query logging is not enabled by default
The query log is disabled by default on all clusters because it generates additional ingest and storage overhead and is intended primarily for troubleshooting, not continuous monitoring. To enable it for your cluster, contact InfluxData support.
Use the Admin UI or the influxctl query command to view the query log.
Access the InfluxDB Cloud Dedicated Admin UI at console.influxdata.com. If you don’t have login credentials, contact InfluxData support.
- Open the cluster you want to inspect and go to Query History.
If query logging is enabled for your cluster, any admin user can access the query log in the Admin UI automatically; no database token is required.
In Query History you can:
- Search by Database Token ID to see queries run with a specific token.
- Filter by:
- Status (for example, success, failure)
- Database
- Query type (for example, SQL, InfluxQL)
- Source (for example, User Queries, UI)
- Time range (for example, last 24 hours)
The table lists each query with its status, query text, database, query type, duration, and timestamp. You can use the column headers to sort (for example by duration or time).
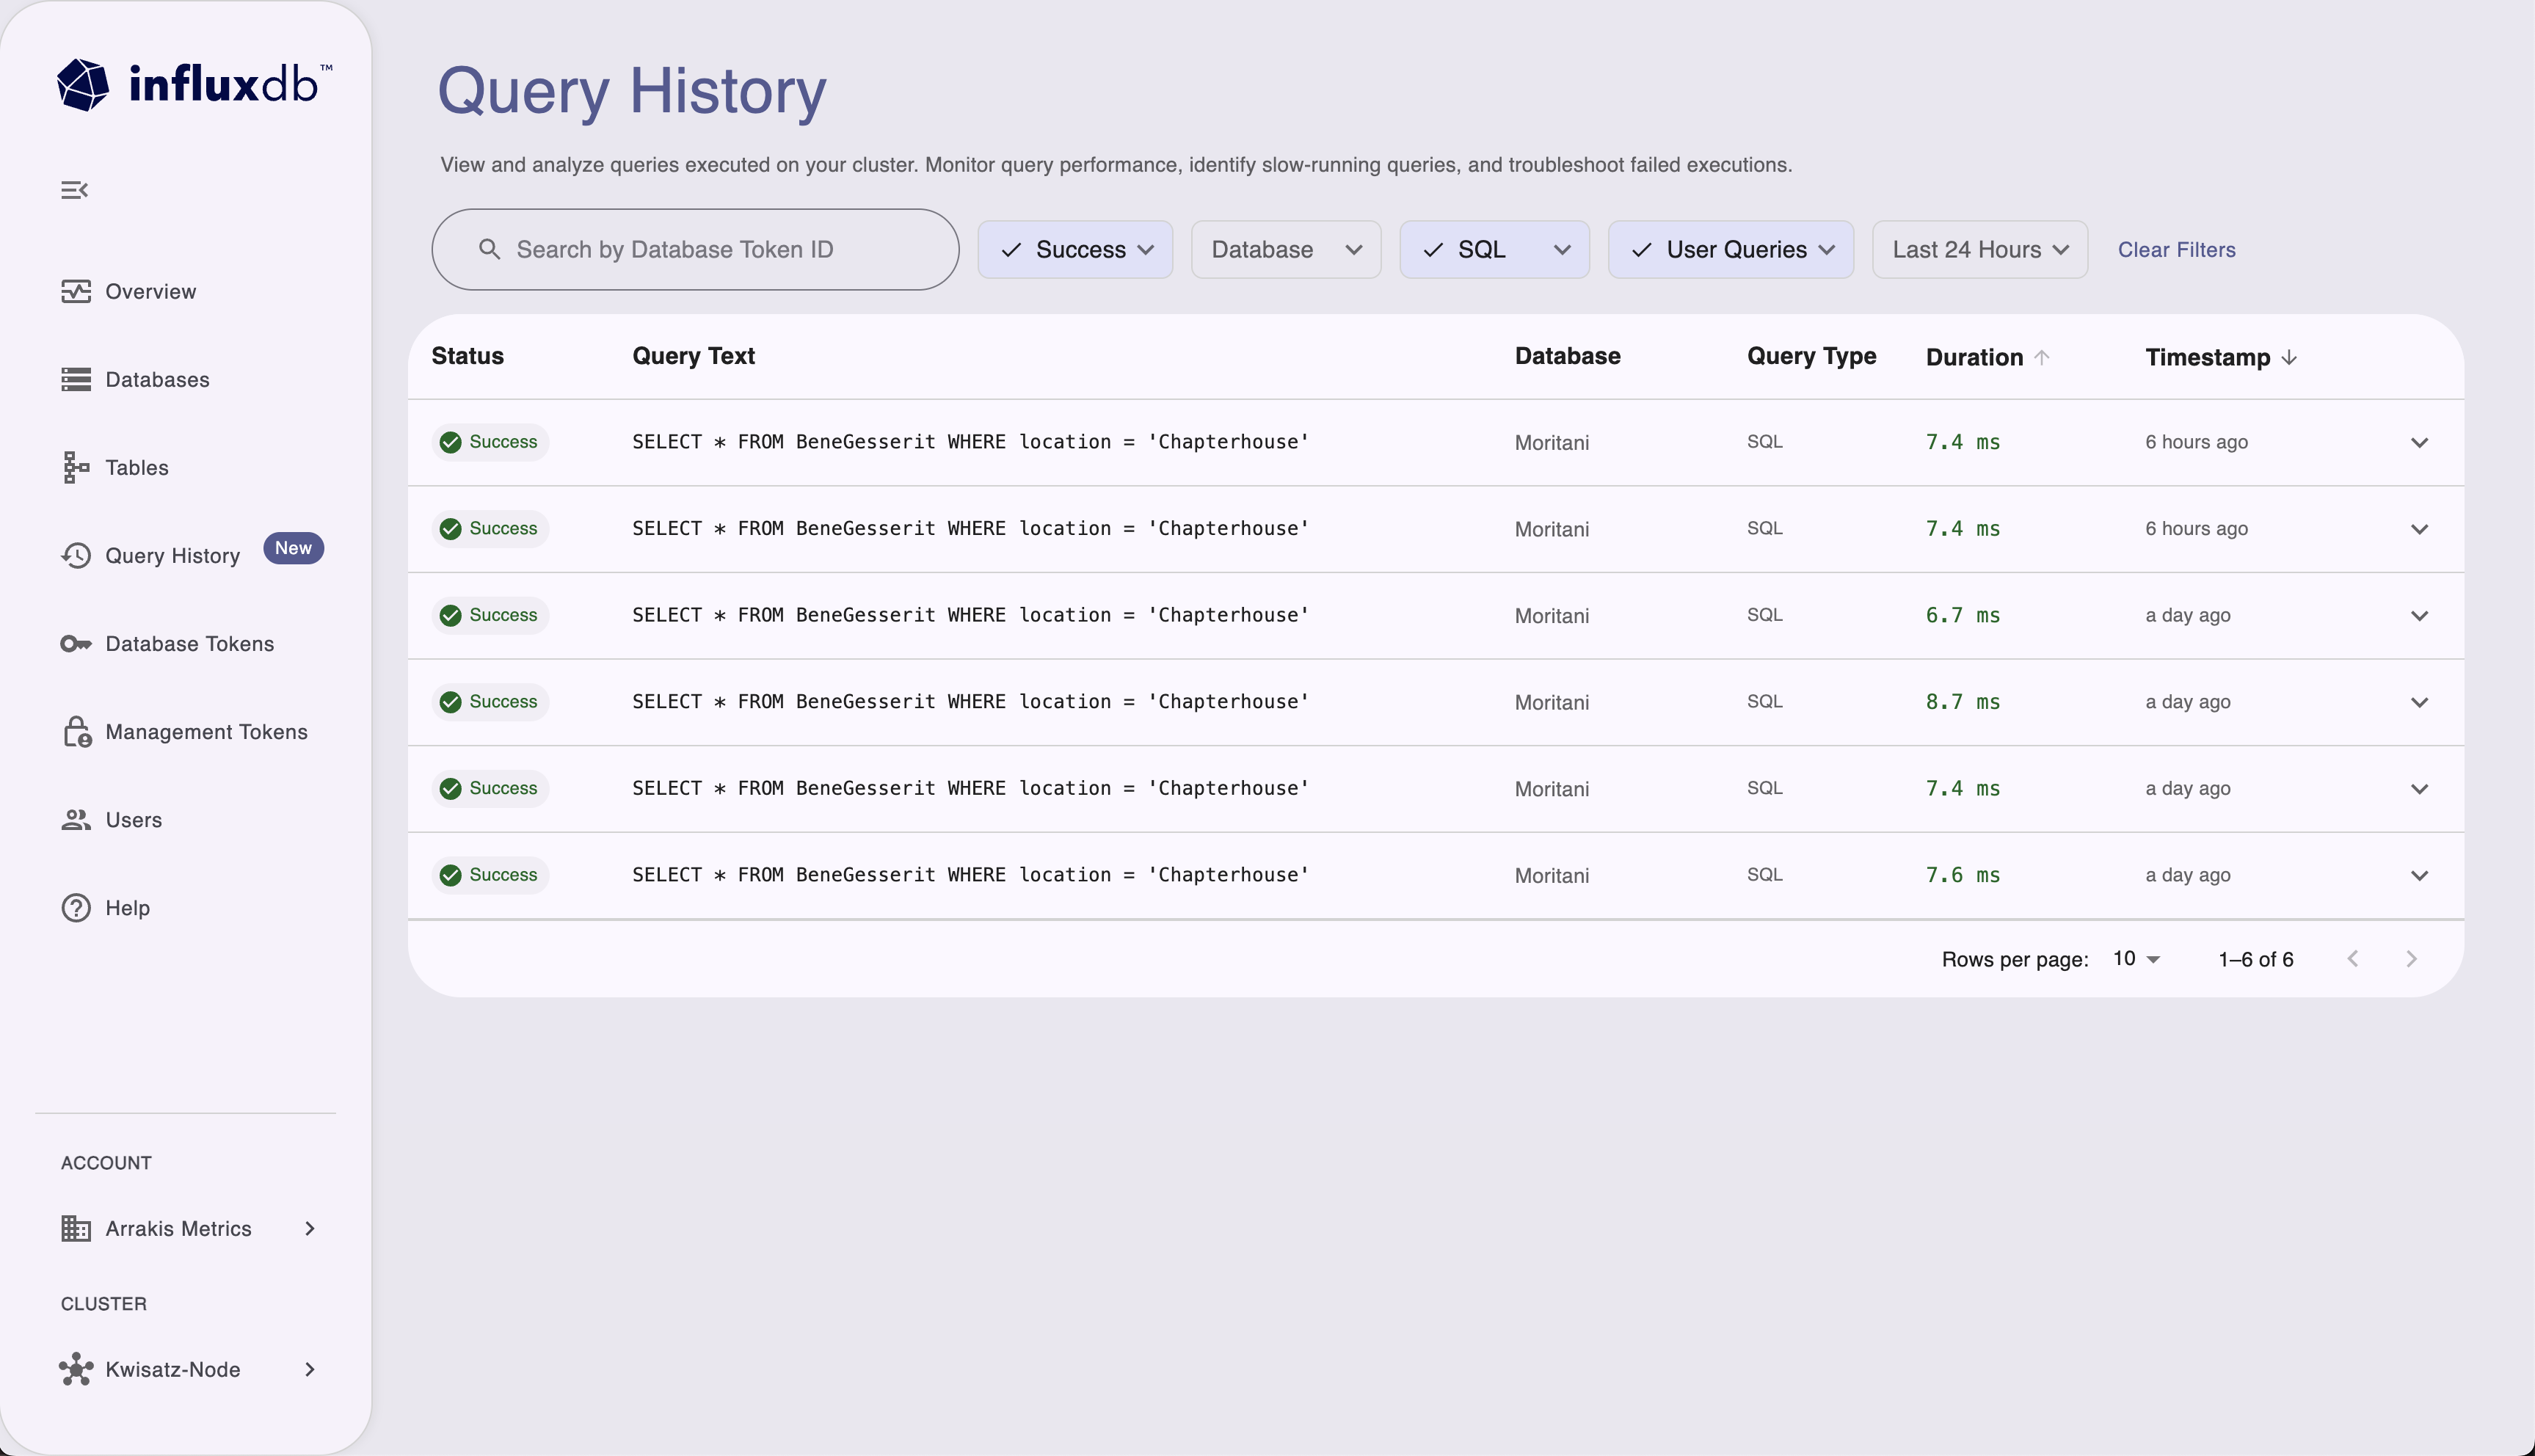
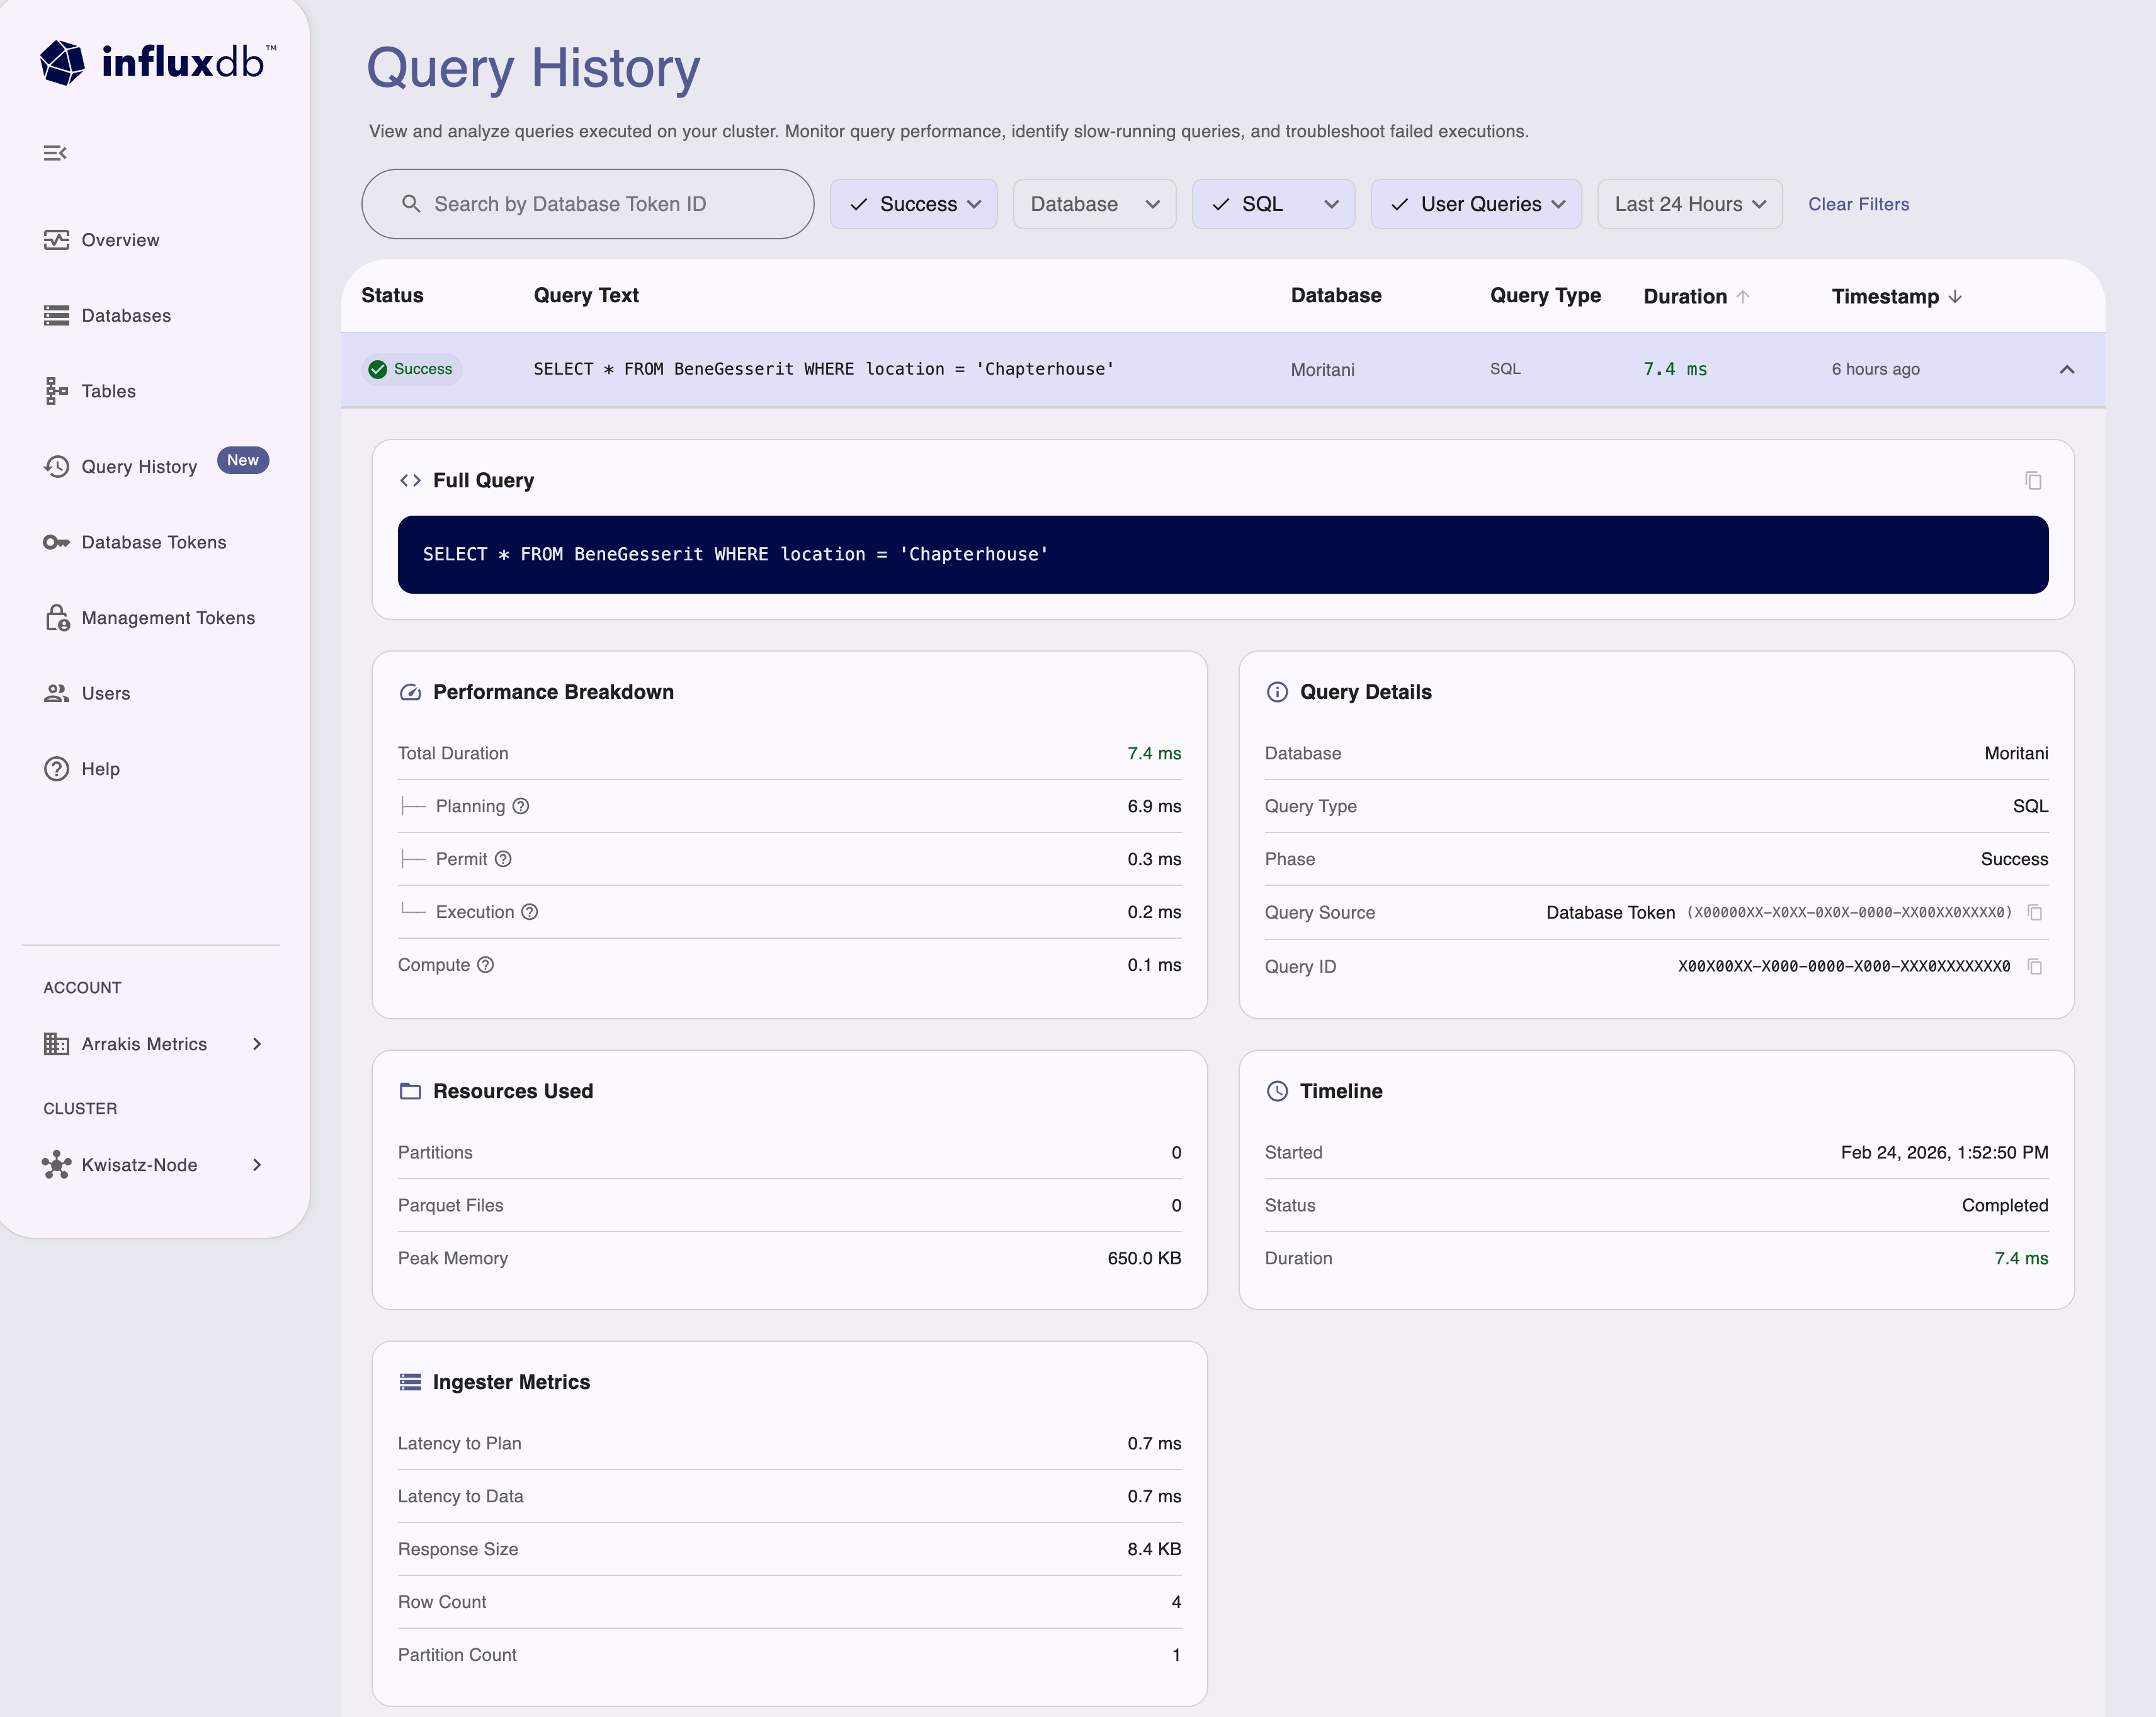
You can also expand a row to see more details about that execution.
Use the influxctl query command
to run SQL against the _internal database and query_log table.
Query log entries are stored in the _internal database.
- If you haven’t already, download and install the
influxctlCLI, and then configure aninfluxctlconnection profile for your cluster. - Create a database token that has read access to the
_internaldatabase. ReplaceDATABASE_TOKENin the examples below with your database token . - Run the query subcommand with
--databaseand--language(and optionally--config). Global flags such as--configmust come before the command; query flags such as--database,--language, and--tokenmust come afterquery.
Examples
List recent successful queries with compute duration above a threshold (for example, 0.6 ms):
influxctl query \
  --token DATABASE_TOKEN \
  --database _internal \
  --language sql \
  'SELECT * FROM query_log WHERE success = '\''true'\'' AND compute_duration_ns > 600000 LIMIT 10'
Filter by namespace (database) and time range:
influxctl query \
  --token DATABASE_TOKEN \
  --database _internal \
  --language sql \
  'SELECT * FROM query_log WHERE namespace_name = '\''my_database'\'' AND time >= now() - INTERVAL '\''1 day'\'' LIMIT 50'
Example output:
| auth_id        | compute_duration_ns | phase   | query_type | query_text                                              | success | time                    |
|----------------|---------------------|---------|------------|---------------------------------------------------------|---------|--------------------------|
| token-id-xxxx  |             2314333 | success | sql        | SELECT * FROM query_log WHERE success = 'true' AND ...  | true    | 2026-02-25T00:30:30Z     |
| token-id-yyyy  |          3673637621 | success | sql        | SELECT * FROM my_measurement WHERE time > now() - ...  | true    | 2026-02-25T00:28:57Z     |
| token-id-yyyy  |          1443145654 | success | sql        | SELECT COUNT(*) FROM query_log WHERE ...                | true    | 2026-02-25T00:29:02Z     |
+----------------+---------------------+---------+------------+---------------------------------------------------------+---------+--------------------------+
Query log data and columns
The query_log table in _internal includes the following columns:
| Column | Data type | Description |
|---|---|---|
| time | timestamp | Timestamp when the query log entry was recorded |
| id | string | Unique identifier for the query |
| namespace_id | string | Internal identifier for the database |
| namespace_name | string | Name of the database where the query was executed |
| query_type | string | Type of query syntax used (sql, influxql) |
| query_text | string | The actual query statement text |
| query_params | string | Query parameters (if applicable) |
| auth_id | string | Database token ID used to authenticate the query |
| trace_id | string | Trace ID for debugging and monitoring |
| success | string | Query execution status ('true' or 'false' as string) |
| running | string | Indicates if query is currently running ('true' or 'false' as string) |
| phase | string | Current query phase (for example, received, planned, permit, success, fail, cancel) |
| query_issue_time_ns | int64 | Time when the query was issued (nanoseconds) |
| permit_duration_ns | int64 | Time spent waiting for query permit (nanoseconds) |
| plan_duration_ns | int64 | Time spent planning the query (nanoseconds) |
| execute_duration_ns | int64 | Time spent executing the query (nanoseconds) |
| end_to_end_duration_ns | int64 | Total end-to-end query duration (nanoseconds) |
| compute_duration_ns | int64 | Compute time for the query (nanoseconds) |
| partition_count | int64 | Number of partitions accessed |
| parquet_file_count | int64 | Number of Parquet files read |
| max_memory_bytes | int64 | Maximum memory used during query execution (bytes) |
Use string literals for status columns
In the query_log table, success and running are stored as strings ('true' or 'false'), not booleans.
In SQL predicates, use string comparison—for example, success = 'true' or running = 'false'—to avoid type coercion errors.
Was this page helpful?
Thank you for your feedback!
Support and feedback
Thank you for being part of our community! We welcome and encourage your feedback and bug reports for InfluxDB Cloud Dedicated and this documentation. To find support, use the following resources:
Customers with an annual or support contract can contact InfluxData Support.