
Use and manage variables
This page documents an earlier version of InfluxDB OSS. InfluxDB 3 Core is the latest stable version.
Dashboard variables let you alter specific components of cells’ queries without having to edit the queries, making it easy to interact with your dashboard cells and explore your data.
Variables are scoped by organization.
Use dashboard variables
Both predefined dashboard variables and custom dashboard variables
are stored in a v record associated with each dashboard.
Reference each variable using dot-notation (e.g. v.variableName).
from(bucket: v.bucket)
    |> range(start: v.timeRangeStart, stop: v.timeRangeStop)
    |> filter(fn: (r) => r._measurement == v.measurement and r._field == v.field)
    |> aggregateWindow(every: v.windowPeriod, fn: mean)
When building Flux queries for dashboard cells, view available dashboard variables in the Variables tab next to the Functions tab.
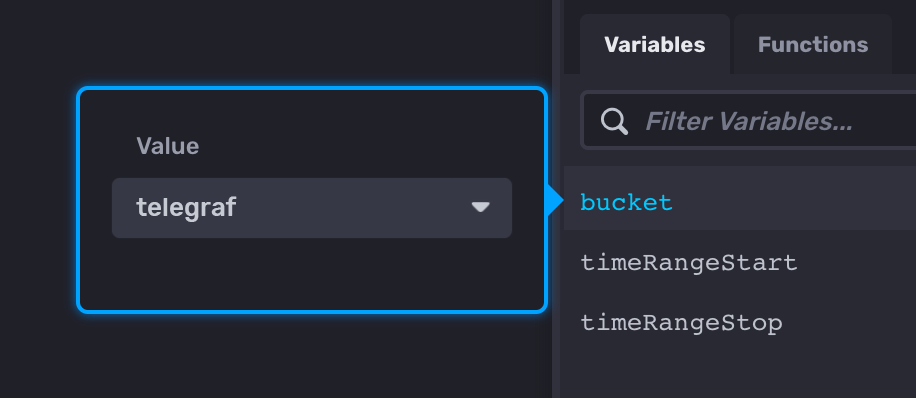
Click a variable name to add it to your query and select a value from the Value dropdown.
Link to dashboards with variables defined in the URL
When you apply a variable to your dashboard, &vars[variable_name]=value is appended to the URL so you can share the link with the variables included.
Predefined dashboard variables
The InfluxDB user interface (UI) provides the following predefined dashboard variables:
v.timeRangeStart
Specifies the beginning of the queried time range.
This variable is typically used to define the start parameter
of the range() function.
The Time Range selector defines the value of this variable.
v.timeRangeStop
Specifies the end of the queried time range.
This variable is typically used to define the stop parameter
of the range() function.
The Time Range selector defines the value of this variable.
It defaults to now.
v.windowPeriod
Specifies the period of windowed data.
This variable is typically used to define the every or period parameters of the
window() function
in data aggregation operations.
The value of this variable is calculated by analyzing the duration of the Flux
query it is used within. Queries that fetch data from a longer time range will
have a larger v.windowPeriod duration.
Custom dashboard variables
Create, manage, and use custom dashboard variables in the InfluxDB user interface (UI).
Create a variable
Create dashboard variables in the Data Explorer, from the Organization page, or import a variable.
Update a variable
Update a dashboard variable in the InfluxDB user interface.
View variables
View dashboard variables in the InfluxDB user interface.
Export a variable
Export a dashboard variable in the InfluxDB user interface.
Delete a variable
Delete a dashboard variable in the InfluxDB user interface.
Variable types
Overview of the types of dashboard variables available in InfluxDB
Common variable queries
Useful queries to use to populate values in common dashboard variable use cases.
Was this page helpful?
Thank you for your feedback!
Support and feedback
Thank you for being part of our community! We welcome and encourage your feedback and bug reports for InfluxDB and this documentation. To find support, use the following resources:
Customers with an annual or support contract can contact InfluxData Support.