
Use Grafana with InfluxDB OSS
This page documents an earlier version of InfluxDB OSS. InfluxDB 3 Core is the latest stable version.
API token hashing is enabled by default in InfluxDB OSS 2.9.0
Stronger token security: tokens are stored as hashes on disk, so a copy of the database file doesn’t expose usable tokens. Existing tokens are hashed on first startup and the original strings can’t be recovered afterward — capture any plaintext tokens you still need before you upgrade.
For more information, see Token hashing.
Use Grafana or Grafana Cloud to visualize data from your InfluxDB 2.9 instance.
Identify your InfluxDB version
If you are unsure which InfluxDB product you are using, use our interactive version detector to help identify it:
Grafana 12.2+
The instructions below are for Grafana 12.2+ with the newInfluxDSConfigPageDesign
feature flag enabled. This introduces the newest version of the InfluxDB core plugin.
The interface dynamically adapts based on your product and query language
selection in URL and authentication.
Install Grafana
If running Grafana locally, enable the
newInfluxDSConfigPageDesignfeature flag to use the latest InfluxDB data source plugin.For more information, see Configure feature toggles in the Grafana documentation.
Visit your Grafana Cloud user interface (UI) or, if running Grafana locally, start Grafana and visit http://localhost:3000 in your browser.
Using Grafana Cloud with a local InfluxDB instance
If you need to keep your database local, consider running Grafana locally instead of using Grafana Cloud, as this avoids the need to expose your database to the internet.
To use InfluxDB running on your private network with Grafana Cloud, you must configure a private data source for Grafana Cloud.
SQL is only supported in InfluxDB 3. For more information, see how to get started with InfluxDB 3 Core.
Quick reference
| Configuration | Value |
|---|---|
| Product selection | InfluxDB OSS 2.x |
|
| URL | Server URL–for example, https://localhost:8086
| | Query languages | Flux, InfluxQL | | Authentication | API token or v1 username/password | | Organization | Organization name or ID (Flux only) | | Default Bucket | Default bucket for Flux queries (Flux only) | | Database | Database name mapped to bucket (InfluxQL only) |
Create an InfluxDB data source
- In your Grafana interface, click Connections in the left sidebar.
- Click Data sources.
- Click Add new connection.
- Search for and select InfluxDB. The InfluxDB data source configuration page displays.
- In the Settings tab, enter a Name for your data source.
Configure URL and authentication
In the URL and authentication section, configure the following:
URL: Your server URL–for example,
https://localhost:8086Product: From the dropdown, select InfluxDB OSS 2.x
Query Language: Select Flux or InfluxQL
(Optional) Advanced HTTP Settings, Auth, and TLS/SSL Settings as needed for your environment
Configure database settings
The fields in this section change based on your query language selection in URL and authentication.
Configure Grafana to use Flux
When you select Flux as the query language, configure the following:
- Organization: Your InfluxDB organization name or ID
- Default Bucket: The default bucket to use in Flux queries
- Token: Your InfluxDB API token
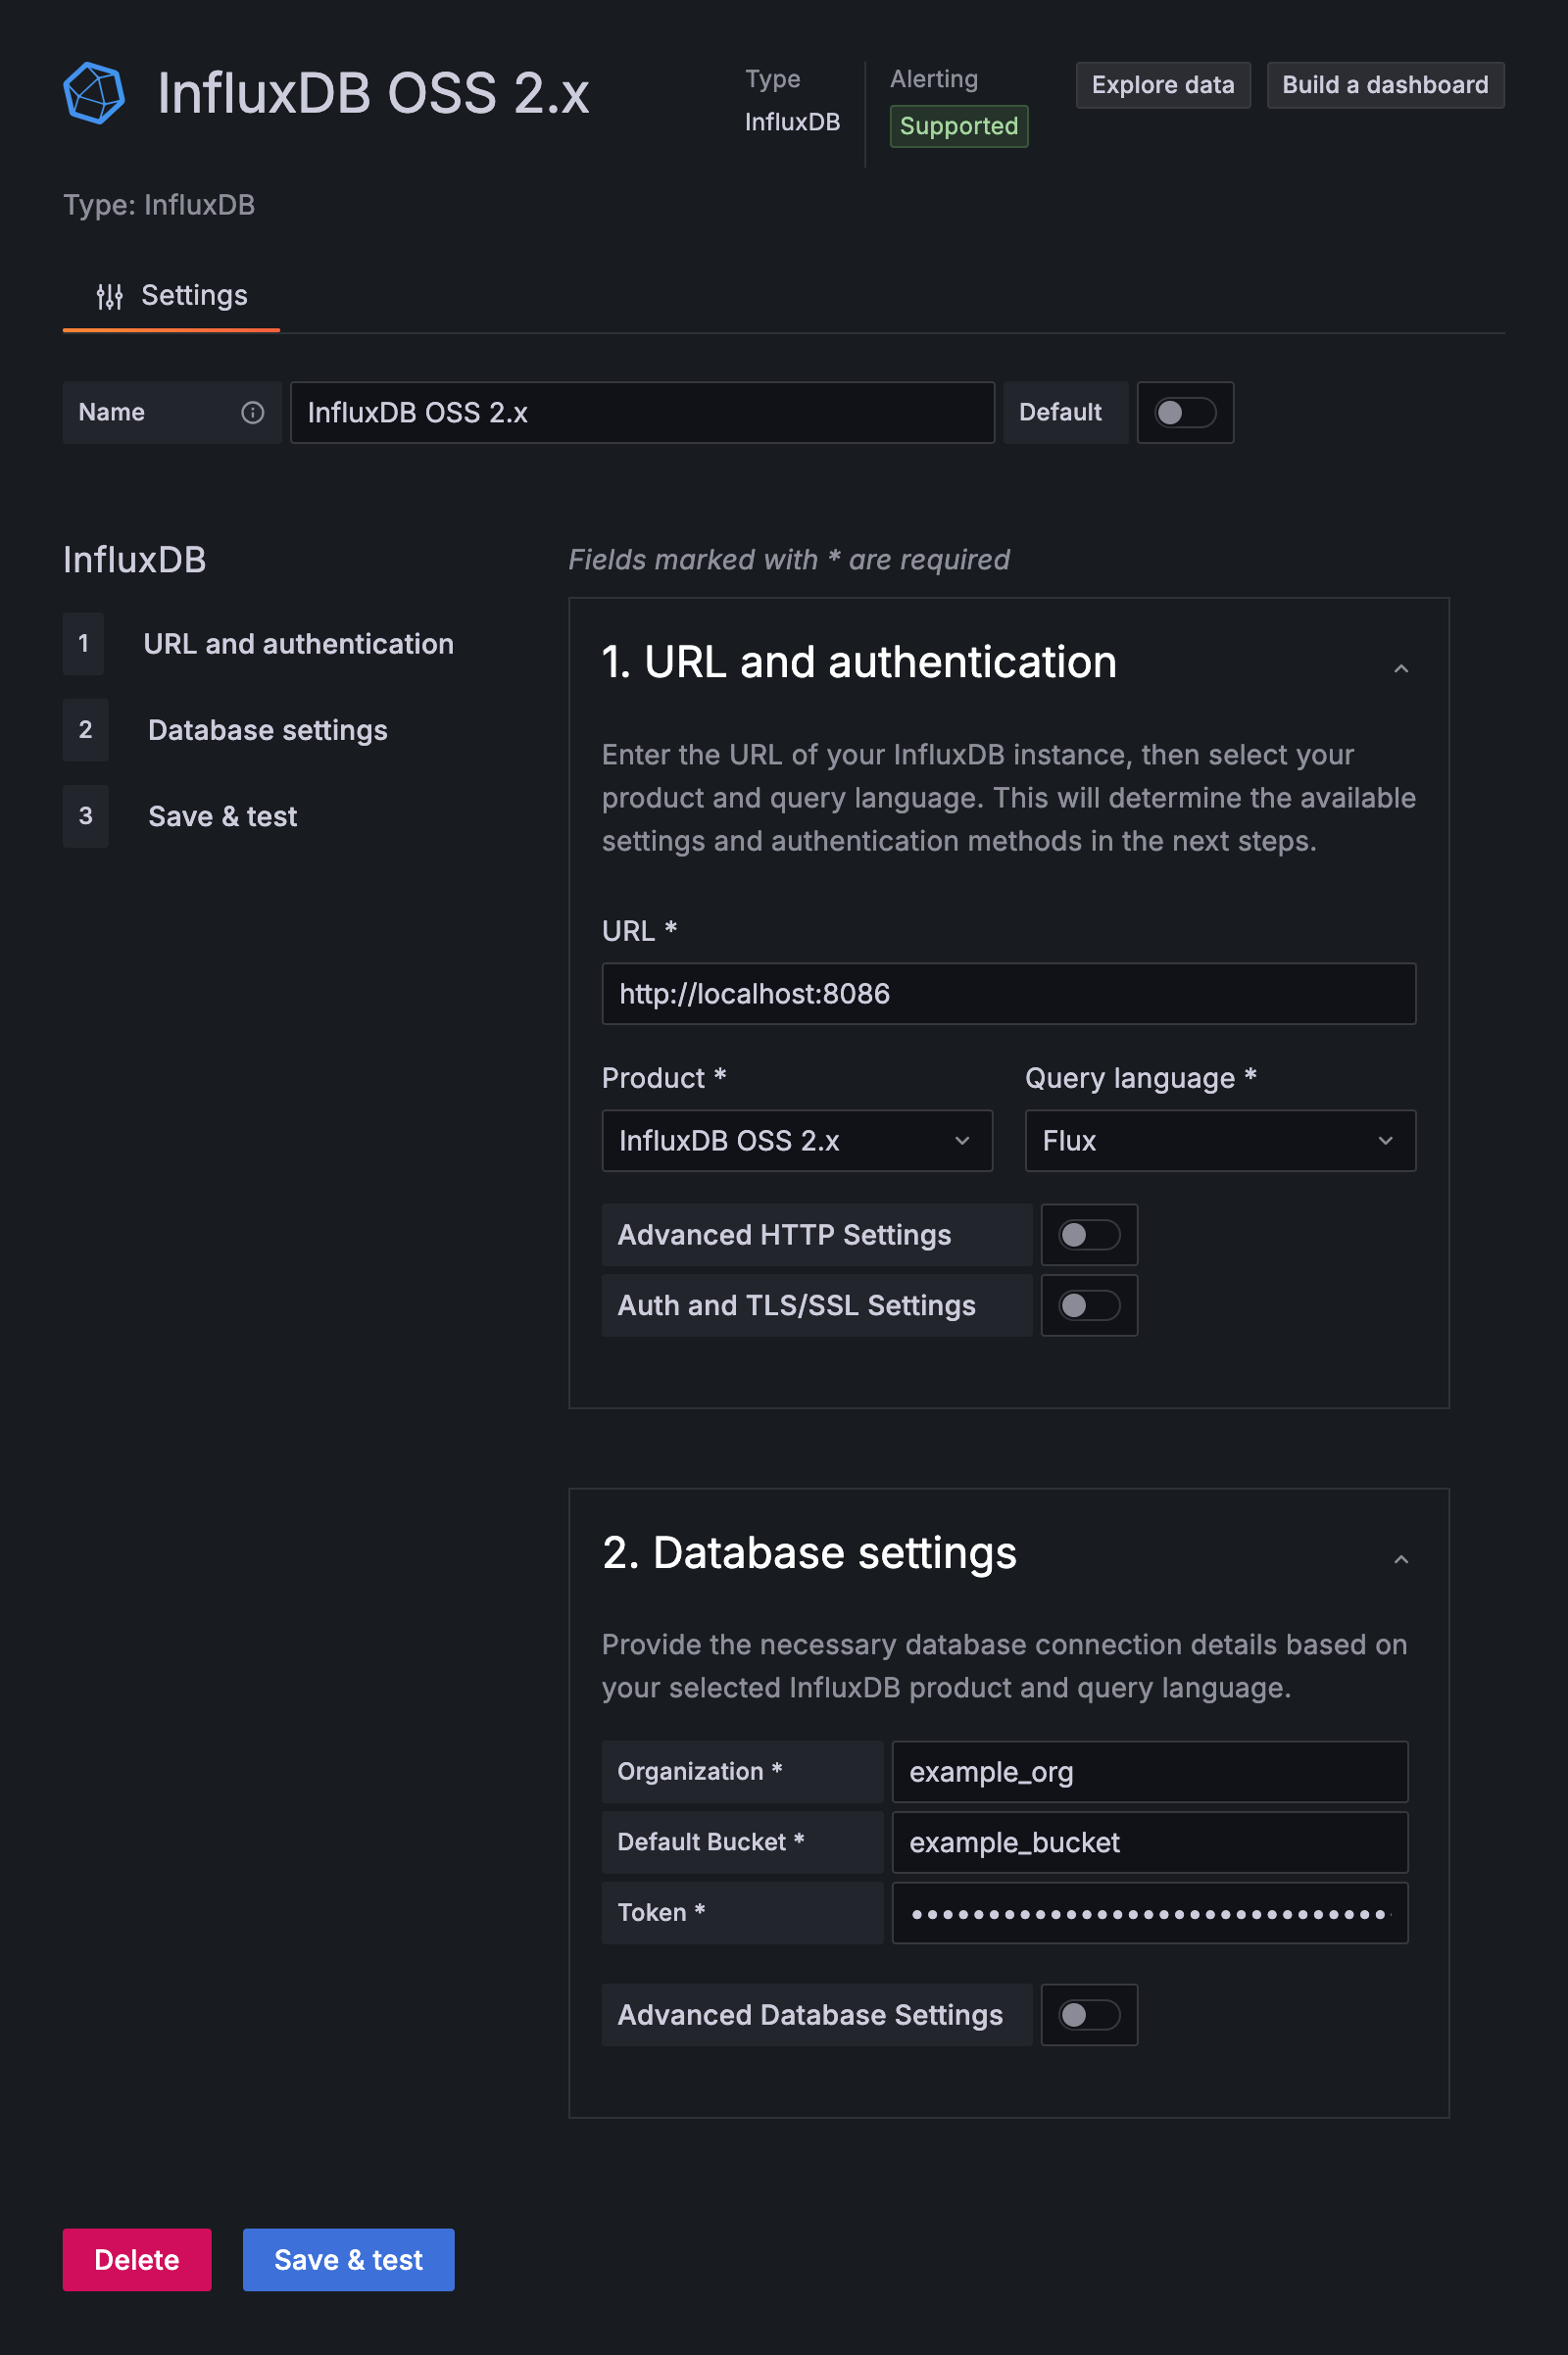
Click Save & Test. Grafana attempts to connect to InfluxDB OSS 2.x
and returns the results of the test.
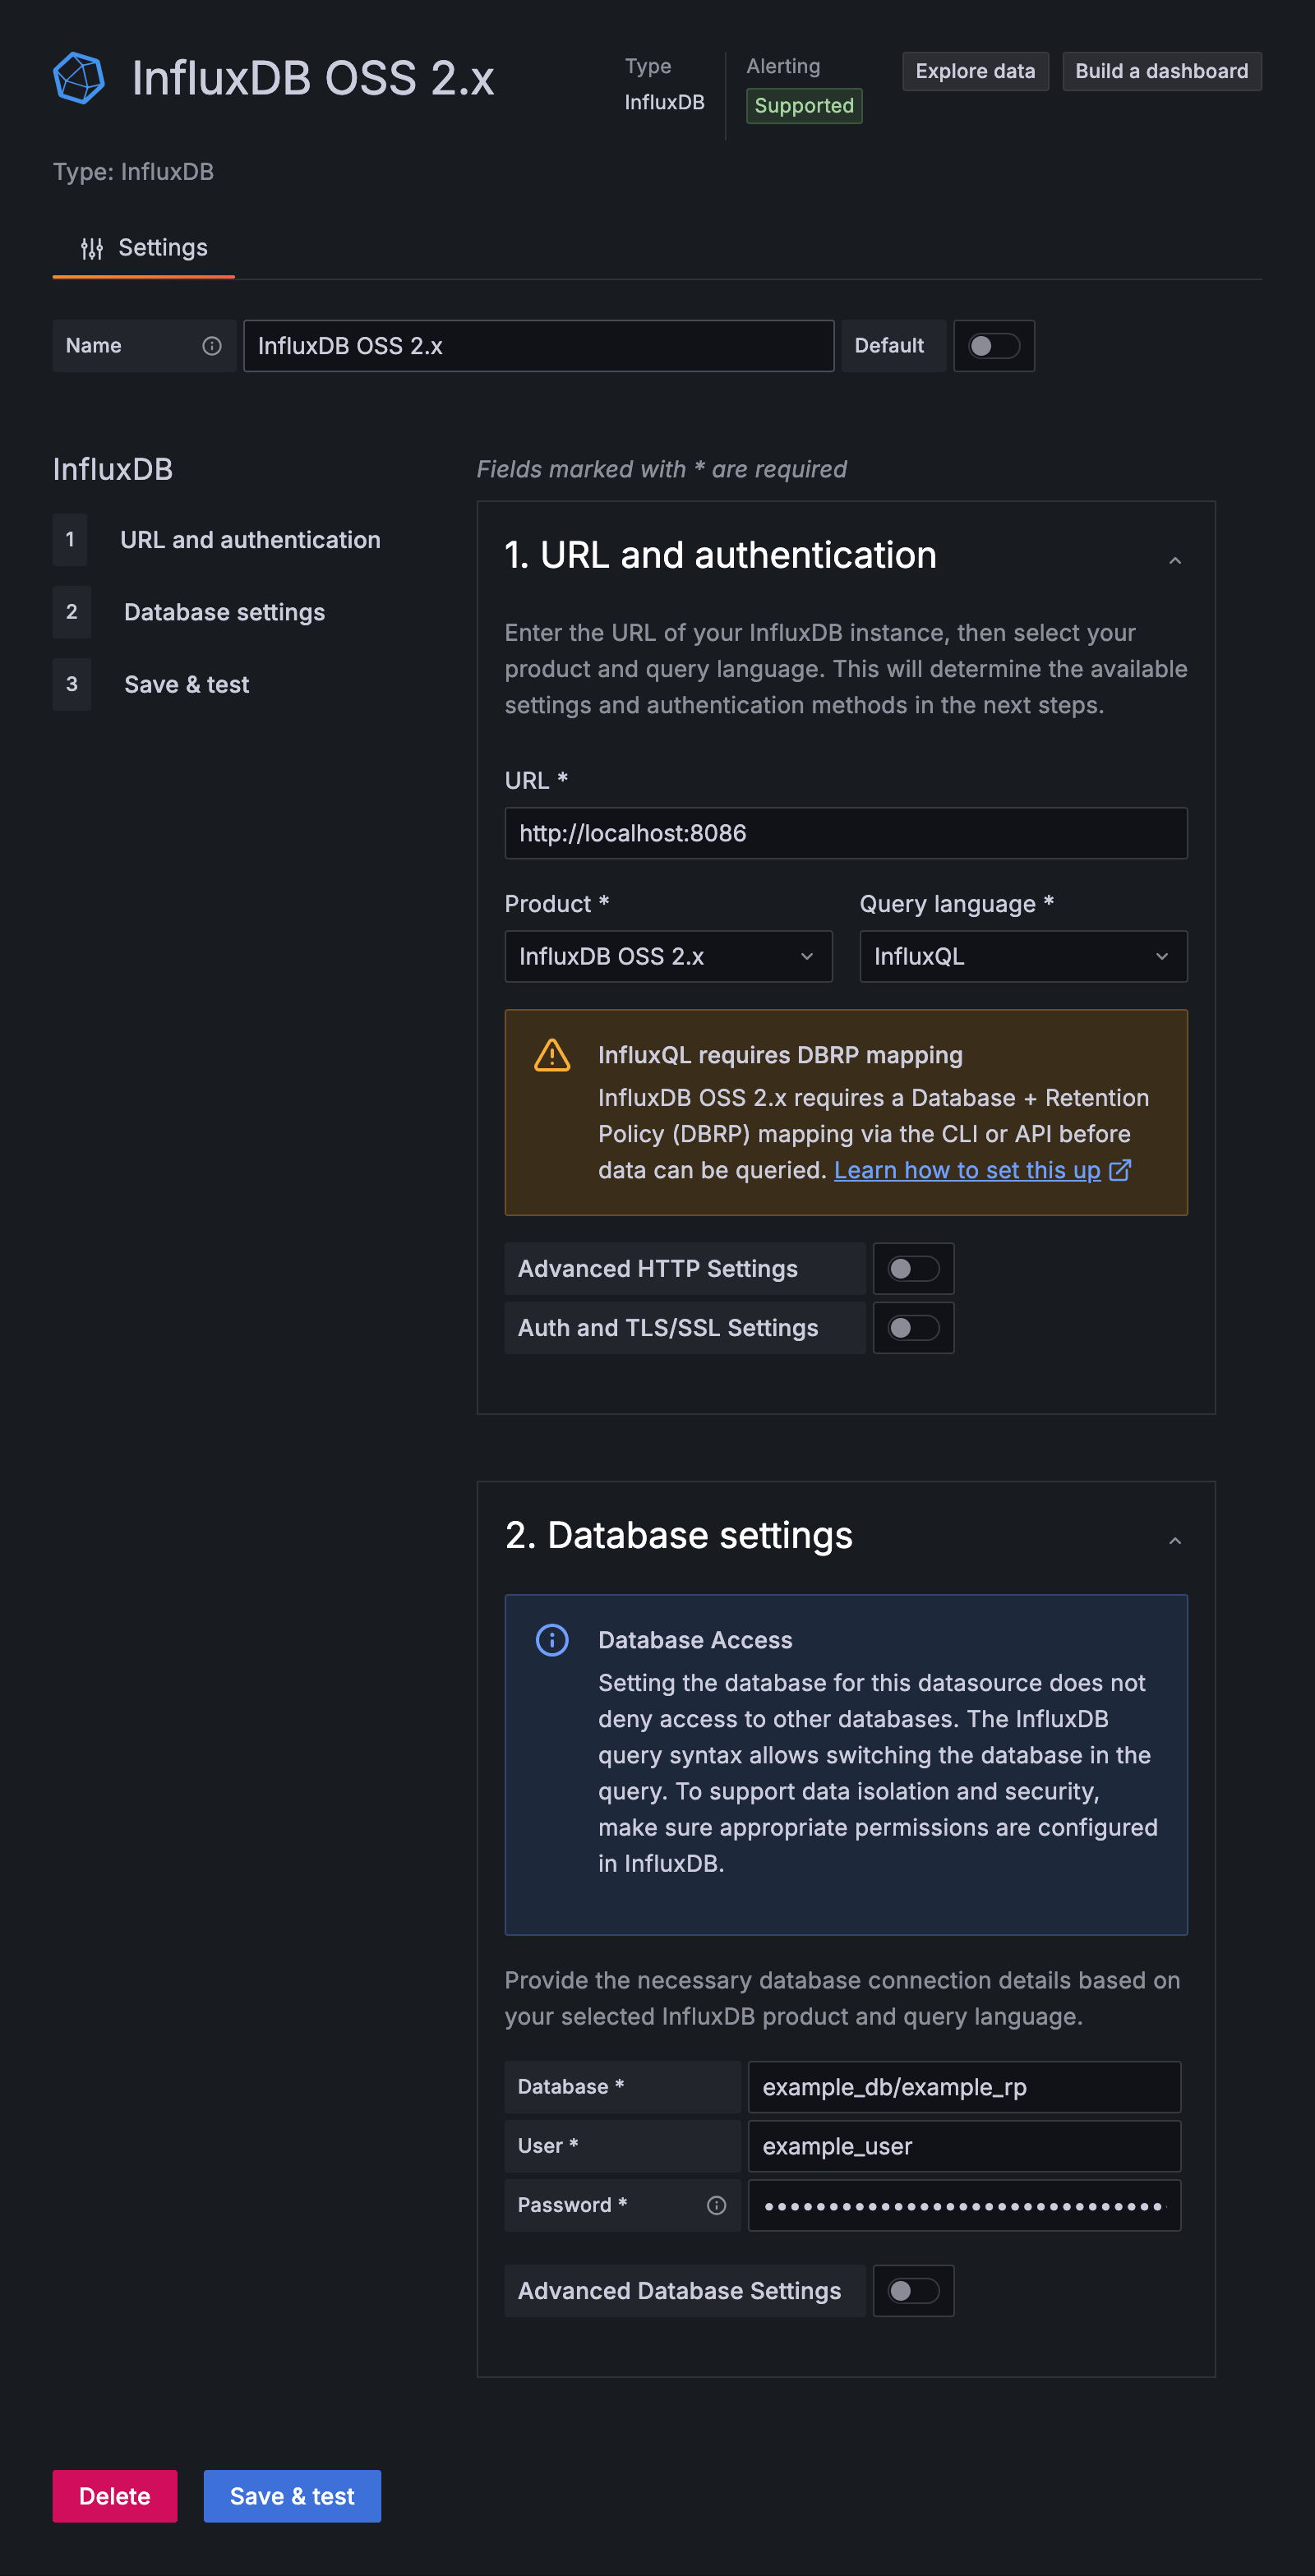
Configure Grafana to use InfluxQL
DBRP mapping required
To query InfluxDB OSS 2.x with InfluxQL, you must first create Database and Retention Policy (DBRP) mappings. The configuration form displays a warning if DBRP mapping is required.
When you select InfluxQL as the query language, you can authenticate using either tokens or username/password credentials.
Token authentication (recommended)
Configure the following fields:
- Database: The database name mapped to your InfluxDB bucket
- User: Enter any string (this field is required by the form)
- Password: Your InfluxDB API token
Username and password authentication
Configure the following fields:
- Database: The database name mapped to your InfluxDB bucket
- User: Your v1 authorization username
- Password: Your v1 authorization password
Click Save & Test. Grafana attempts to connect to InfluxDB OSS 2.x
and returns the results of the test.
Create DBRP mappings
When using InfluxQL to query InfluxDB, the query must specify a database and retention policy. InfluxDB DBRP mappings associate database and retention policy combinations with InfluxDB OSS 2.x buckets.
View existing DBRP mappings
Use the influx v1 dbrp list command:
influx v1 dbrp listCreate a DBRP mappings
Use the influx v1 dbrp create command:
influx v1 dbrp create \
  --db example-db \
  --rp example-rp \
  --bucket-id 00xX00o0X001 \
  --default
Provide:
--db:Database name--rp:Retention policy name (not retention period)--bucket-id:Bucket ID--default:(Optional) Make this the default retention policy for the database
Repeat for each DBRP combination Each unique database and retention policy combination used by Grafana must be mapped to an InfluxDB OSS 2.x bucket.
For more information, see Database and retention policy mapping.
Create v1 authorizations
InfluxDB OSS 2.x provides a v1-compatible authentication API for username/password authentication.
View existing v1 authorizations
Use the influx v1 auth list command:
influx v1 auth listCreate a v1 authorization
Use the influx v1 auth create command:
influx v1 auth create \
  --read-bucket 00xX00o0X001 \
  --write-bucket 00xX00o0X001 \
  --username example-user
Provide:
--read-bucket: Bucket ID to grant read permissions--write-bucket: Bucket ID to grant write permissions--username: New username
You’ll be prompted to enter a password.
Query and visualize data
With your InfluxDB connection configured, use Grafana to query and visualize time series data.
Query inspection in Grafana
To learn about query management and inspection in Grafana, see the Grafana Explore documentation.
Build visualizations with Grafana
For a comprehensive walk-through of creating visualizations with Grafana, see the Grafana documentation.
Was this page helpful?
Thank you for your feedback!
Support and feedback
Thank you for being part of our community! We welcome and encourage your feedback and bug reports for InfluxDB OSS v2 and this documentation. To find support, use the following resources:
Customers with an annual or support contract can contact InfluxData Support.