Explore metrics with InfluxDB
Explore and visualize your data in the Data Explorer. The InfluxDB user interface (UI) allows you to move seamlessly between using the Flux builder or templates and manually editing the query. Choose between visualization types for your query.
To open the Data Explorer, click the Explore (Data Explorer) icon in the left navigation menu:
Explore data with Flux and the Data Explorer
Flux is InfluxData’s functional data scripting language designed for querying, analyzing, and acting on time series data. See Get started with Flux to learn more about Flux.
In the navigation menu on the left, click Data Explorer.
Use the Flux builder in the bottom panel to create a Flux query:
- Select a bucket to define your data source or select
+ Create Bucketto add a new bucket. - Edit your time range with the time range option in the dropdown menu.
- Add filters to narrow your data by selecting attributes or columns in the dropdown menu.
- Select Group from the Filter dropdown menu to group data into tables. For more about how grouping data in Flux works, see Group data.
- Alternatively, click Script Editor to manually edit the query. To switch back to the query builder, click Query Builder. Note that your updates from the Script Editor will not be saved.
- Use the Functions list to review the available Flux functions. Click a function from the list to add it to your query.
- Click Submit (or press
Control+Enter) to run your query. You can then preview your graph in the above pane. To cancel your query while it’s running, click Cancel. - To work on multiple queries at once, click the to add another tab.
- Click the eye icon on a tab to hide or show a query’s visualization.
- Click the name of the query in the tab to rename it.
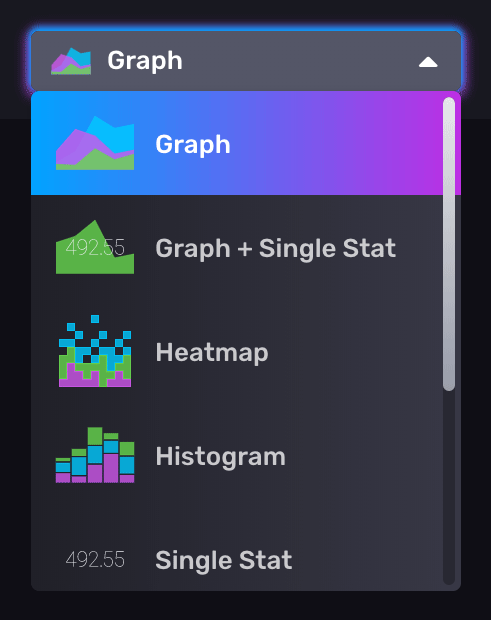
Visualize your query
Select an available visualization types from the dropdown menu in the upper-left:

Control your dashboard cell
To open the cell editor overlay, click the gear icon in the upper right of a cell and select Configure. The cell editor overlay opens.
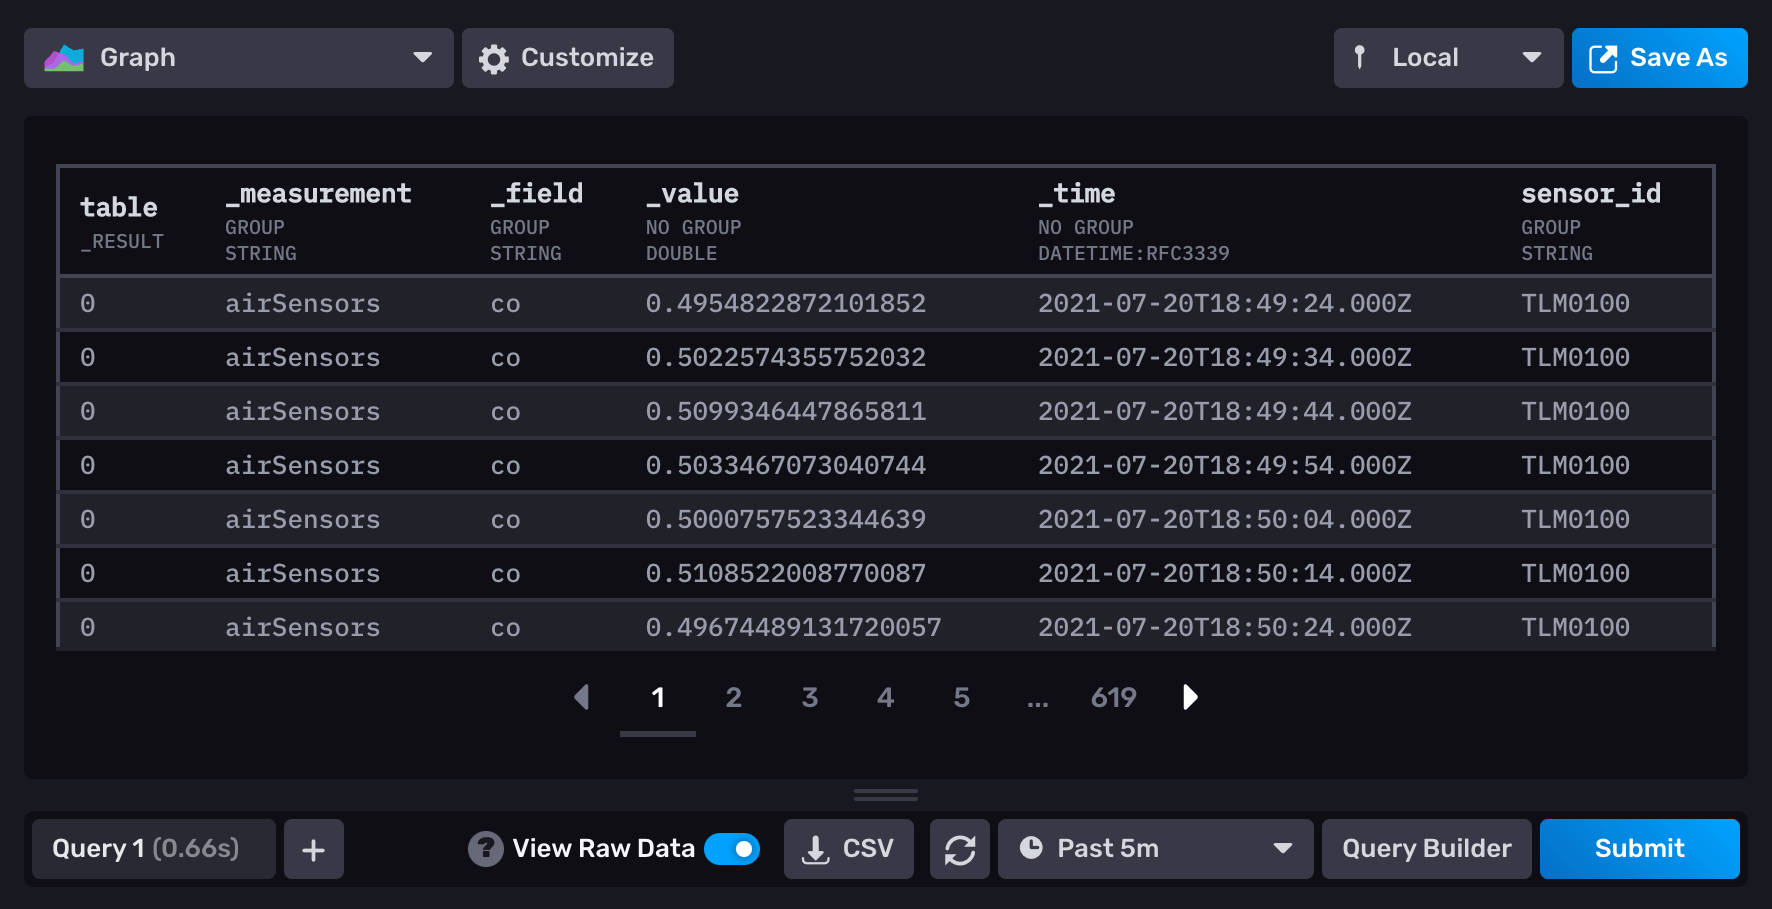
View raw data
Toggle the View Raw Data option to see your data in table format instead of a graph. Scroll through raw data using arrows, or click page numbers to find specific tables. Group keys and data types are easily identifiable at the top of each column underneath the headings. Use this option when data can’t be visualized using a visualization type.

Save as CSV
Click the CSV icon to save the cells contents as a CSV file.
Manually refresh dashboard
Click the refresh button () to manually refresh the dashboard’s data.
Select time range
Select from the time range options in the dropdown menu.

Select Custom Time Range to enter a custom time range with precision up to nanoseconds. The default time range is 5m.
The custom time range uses the selected timezone (local time or UTC).
Query Builder or Script Editor
Click Query Builder to use the builder to create a Flux query. Click Script Editor to manually edit the query.
Keyboard shortcuts
In Script Editor mode, the following keyboard shortcuts are available:
| Key | Description |
|---|---|
Control + / (⌘ + / on Mac) | Comment/uncomment current or selected lines |
Control + Enter | Submit query |
Save your query as a dashboard cell or task
To save your query:
Click Save as in the upper right, then:
- To add your query to a dashboard, click Dashboard Cell.
- To save your query as a task, click Task.
- To save your query as a variable, click Variable.
Was this page helpful?
Thank you for your feedback!
Support and feedback
Thank you for being part of our community! We welcome and encourage your feedback and bug reports for InfluxDB and this documentation. To find support, use the following resources:
Customers with an annual or support contract can contact InfluxData Support.
