
Monitor InfluxDB Enterprise clusters
InfluxDB Enterprise offers high availability and a highly scalable clustering solution for your time series data needs. Use Chronograf to assess your cluster’s health and to monitor the infrastructure behind your project.
This guide offers step-by-step instructions for using Chronograf, InfluxDB, and Telegraf to monitor data nodes in your InfluxDB Enterprise cluster.
Requirements
You have a fully-functioning InfluxDB Enterprise cluster with authentication enabled. See the InfluxDB Enterprise documentation for detailed setup instructions. This guide uses an InfluxData Enterprise cluster with three meta nodes and three data nodes; the steps are also applicable to other cluster configurations.
InfluxData recommends using a separate server to store your monitoring data. It is possible to store the monitoring data in your cluster and connect the cluster to Chronograf, but, in general, your monitoring data should live on a separate server.
You’re working on an Ubuntu installation. Chronograf and the other components of the TICK stack are supported on several operating systems and hardware architectures. Check out the downloads page for links to the binaries of your choice.
Architecture overview
Before we begin, here’s an overview of the final monitoring setup:

The diagram above shows an InfluxDB Enterprise cluster that consists of three meta nodes (M) and three data nodes (D). Each data node has its own Telegraf instance (T).
Each Telegraf instance is configured to collect node CPU, disk, and memory data using the Telegraf system stats input plugin. The Telegraf instances are also configured to send those data to a single InfluxDB OSS instance that lives on a separate server. When Telegraf sends data to InfluxDB, it automatically tags the data with the hostname of the relevant data node.
The InfluxDB OSS instance that stores the Telegraf data is connected to Chronograf. Chronograf uses the hostnames in the Telegraf data to populate the Host List page and provide other hostname-specific information in the user interface.
Setup description
InfluxDB OSS setup
Step 1: Download and install InfluxDB
InfluxDB can be downloaded from the InfluxData downloads page.
Step 2: Enable authentication
For security purposes, enable authentication in the InfluxDB configuration file (influxdb.conf), which is located in /etc/influxdb/influxdb.conf.
In the [http] section of the configuration file, uncomment the auth-enabled option and set it to true:
[http]
  # Determines whether HTTP endpoint is enabled.
  # enabled = true

  # The bind address used by the HTTP service.
  # bind-address = ":8086"

  # Determines whether HTTP authentication is enabled.
  auth-enabled = true #💥
Step 3: Start InfluxDB
Next, start the InfluxDB process:
~# sudo systemctl start influxdbStep 4: Create an admin user
Create an admin user on your InfluxDB instance.
Because you enabled authentication, you must perform this step before moving on to the next section.
Run the command below to create an admin user, replacing chronothan and supersecret with your own username and password.
Note that the password requires single quotes.
~# curl -XPOST "http://localhost:8086/query" --data-urlencode "q=CREATE USER chronothan WITH PASSWORD 'supersecret' WITH ALL PRIVILEGES"A successful CREATE USER query returns a blank result:
{"results":[{"statement_id":0}]} <--- Success!Telegraf setup
Perform the following steps on each data node in your cluster. You’ll return to your InfluxDB instance at the end of this section.
Step 1: Download and install Telegraf
Telegraf can be downloaded from the InfluxData downloads page.
Step 2: Configure Telegraf
Configure Telegraf to write monitoring data to your InfluxDB OSS instance.
The Telegraf configuration file is located in /etc/telegraf/telegraf.conf.
First, in the [[outputs.influxdb]] section, set the urls option to the IP address and port of your InfluxDB OSS instance.
InfluxDB runs on port 8086 by default.
This step ensures that Telegraf writes data to your InfluxDB OSS instance.
[[outputs.influxdb]]
  ## The full HTTP or UDP endpoint URL for your InfluxDB instance.
  ## Multiple urls can be specified as part of the same cluster,
  ## this means that only ONE of the urls will be written to each interval.
  # urls = ["udp://localhost:8089"] # UDP endpoint example
  urls = ["http://xxx.xx.xxx.xxx:8086"] #💥
Next, in the same [[outputs.influxdb]] section, uncomment and set the username and password options to the username and password that you created in the previous section.
Telegraf must be aware your username and password to successfully write data to your InfluxDB OSS instance.
[[outputs.influxdb]]
  ## The full HTTP or UDP endpoint URL for your InfluxDB instance.
  ## Multiple urls can be specified as part of the same cluster,
  ## this means that only ONE of the urls will be written to each interval.
  # urls = ["udp://localhost:8089"] # UDP endpoint example
  urls = ["http://xxx.xx.xxx.xxx:8086"] # required

  [...]

  ## Write timeout (for the InfluxDB client), formatted as a string.
  ## If not provided, will default to 5s. 0s means no timeout (not recommended).
  timeout = "5s"
  username = "chronothan" #💥
  password = "supersecret" #💥
The Telegraf System input plugin is enabled by default and requires no additional configuration.
The input plugin automatically collects general statistics on system load, uptime, and the number of users logged in.
Enabled input plugins are configured in the INPUT PLUGINS section of the configuration file; for example, here’s the section that controls the CPU data collection:
###############################################################################
#                            INPUT PLUGINS                                    #
###############################################################################

# Read metrics about cpu usage
[[inputs.cpu]]
  ## Whether to report per-cpu stats or not
  percpu = true
  ## Whether to report total system cpu stats or not
  totalcpu = true
  ## If true, collect raw CPU time metrics.
  collect_cpu_time = false
Step 3: Restart the Telegraf service
Restart the Telegraf service so that your configuration changes take effect:
macOS
telegraf --config telegraf.confLinux (sysvinit and upstart installations)
sudo service telegraf restartLinux (systemd installations)
systemctl restart telegrafRepeat steps one through four for each data node in your cluster.
Step 4: Confirm the Telegraf setup
To verify Telegraf is successfully collecting and writing data, use one of the following methods to query your InfluxDB OSS instance:
InfluxDB CLI (influx)
$ influx
> SHOW TAG VALUES FROM cpu WITH KEY=host
curl
Replace the chronothan and supersecret values with your actual username and password.
~# curl -G "http://localhost:8086/query?db=telegraf&u=chronothan&p=supersecret&pretty=true" --data-urlencode "q=SHOW TAG VALUES FROM cpu WITH KEY=host"The expected output is similar to the JSON code block below.
In this case, the telegraf database has three different tag values for the host tag key: data-node-01, data-node-02, and data-node-03.
Those values match the hostnames of the three data nodes in the cluster; this means Telegraf is successfully writing monitoring data from those hosts to the InfluxDB OSS instance!
{
    "results": [
        {
            "statement_id": 0,
            "series": [
                {
                    "name": "cpu",
                    "columns": [
                        "key",
                        "value"
                    ],
                    "values": [
                        [
                            "host",
                            "data-node-01"
                        ],
                        [
                            "host",
                            "data-node-02"
                        ],
                        [
                            "host",
                            "data-node-03"
                        ]
                    ]
                }
            ]
        }
    ]
}
Chronograf Setup
Step 1: Download and install Chronograf
Download and install Chronograf on the same server as the InfluxDB instance. This is not a requirement; you may host Chronograf on a separate server.
Chronograf can be downloaded from the InfluxData downloads page.
Step 2: Start Chronograf
~# sudo systemctl start chronografStep 3: Connect Chronograf to the InfluxDB OSS instance
To access Chronograf, go to http://localhost:8888. The welcome page includes instructions for connecting Chronograf to that instance.

For the Connection String, enter the hostname or IP of your InfluxDB OSS instance, and be sure to include the default port: 8086.
Next, name your data source; this can be anything you want.
Finally, enter your username and password and click Add Source.
Step 4: Explore the monitoring data in Chronograf
Chronograf works with the Telegraf data in your InfluxDB OSS instance.
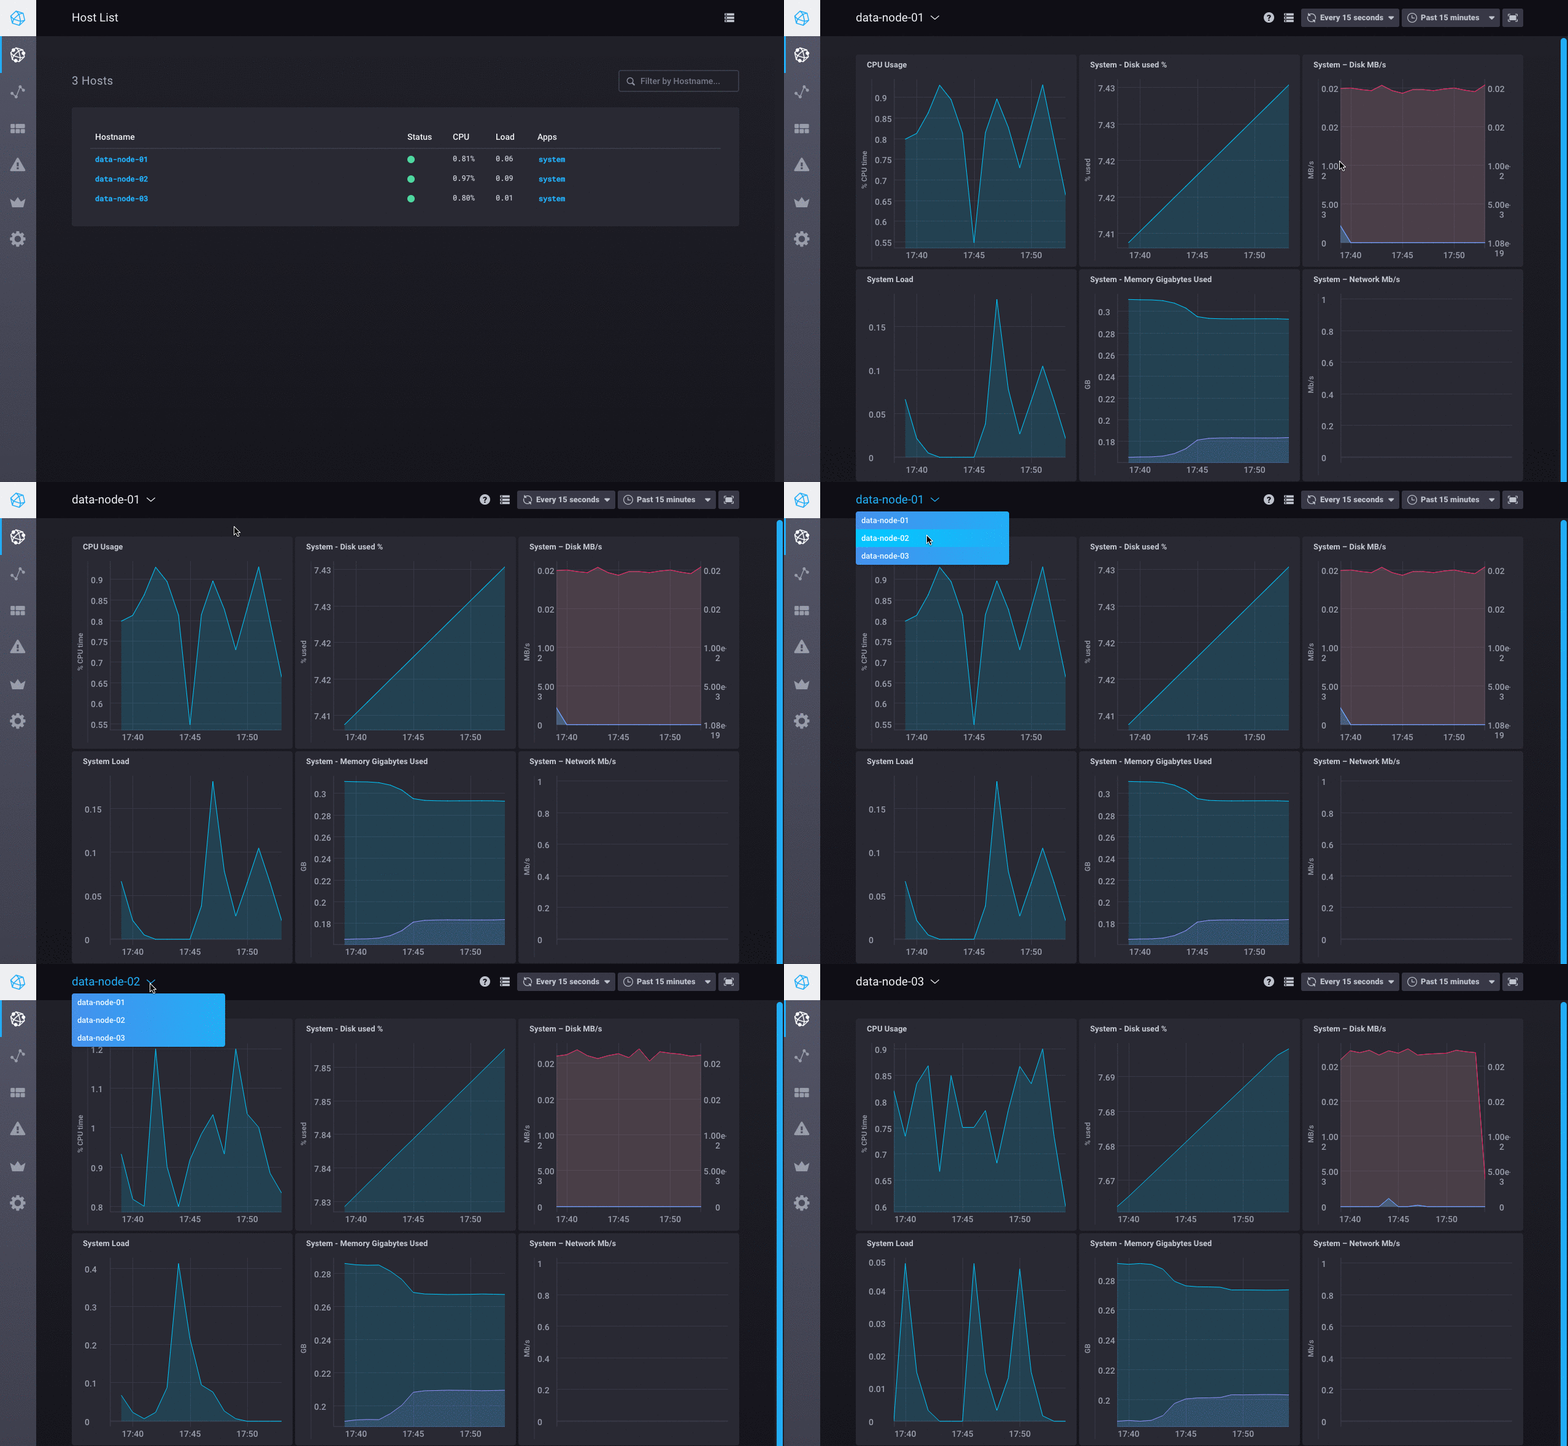
The Host List page shows your data node’s hostnames, their statuses, CPU usage, load, and their configured applications.
In this case, you’ve only enabled the system stats input plugin so system is the single application that appears in the Apps column.

Click system to see the Chronograf canned dashboard for that application.
Keep an eye on your data nodes by viewing that dashboard for each hostname:
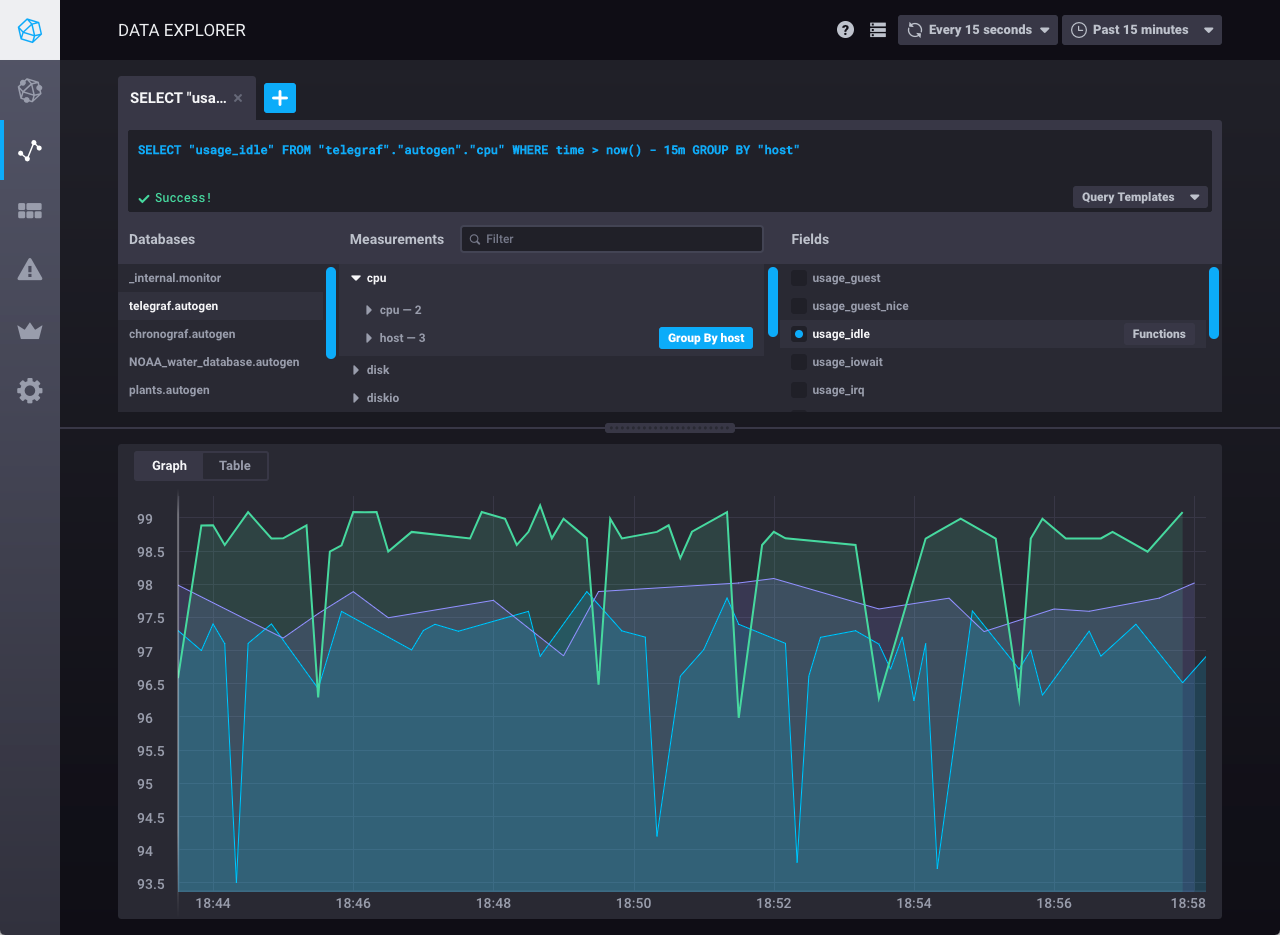
Next, check out the Data Explorer to create a customized graph with the monitoring data. In the image below, the Chronograf query editor is used to visualize the idle CPU usage data for each data node:
Create more customized graphs and save them to a dashboard on the Dashboard page in Chronograf. See the Creating Chronograf dashboards guide for more information.
That’s it! You’ve successfully configured Telegraf to collect and write data, InfluxDB to store those data, and Chronograf to use those data for monitoring and visualization purposes.
Was this page helpful?
Thank you for your feedback!
Support and feedback
Thank you for being part of our community! We welcome and encourage your feedback and bug reports for Chronograf and this documentation. To find support, use the following resources: