
Create Chronograf dashboards
Chronograf offers a complete dashboard solution for visualizing your data and monitoring your infrastructure:
- View pre-created dashboards from the Host List page. Dashboards are available depending on which Telegraf input plugins you have enabled. These pre-created dashboards cannot be cloned or edited.
- Create custom dashboards from scratch by building queries in the Data Explorer, as described below.
- Export a dashboard you create.
- Import a dashboard:
- When you want to import an exported dashboard.
- When you want to add or update a connection in Chronograf. See Dashboard templates for details.
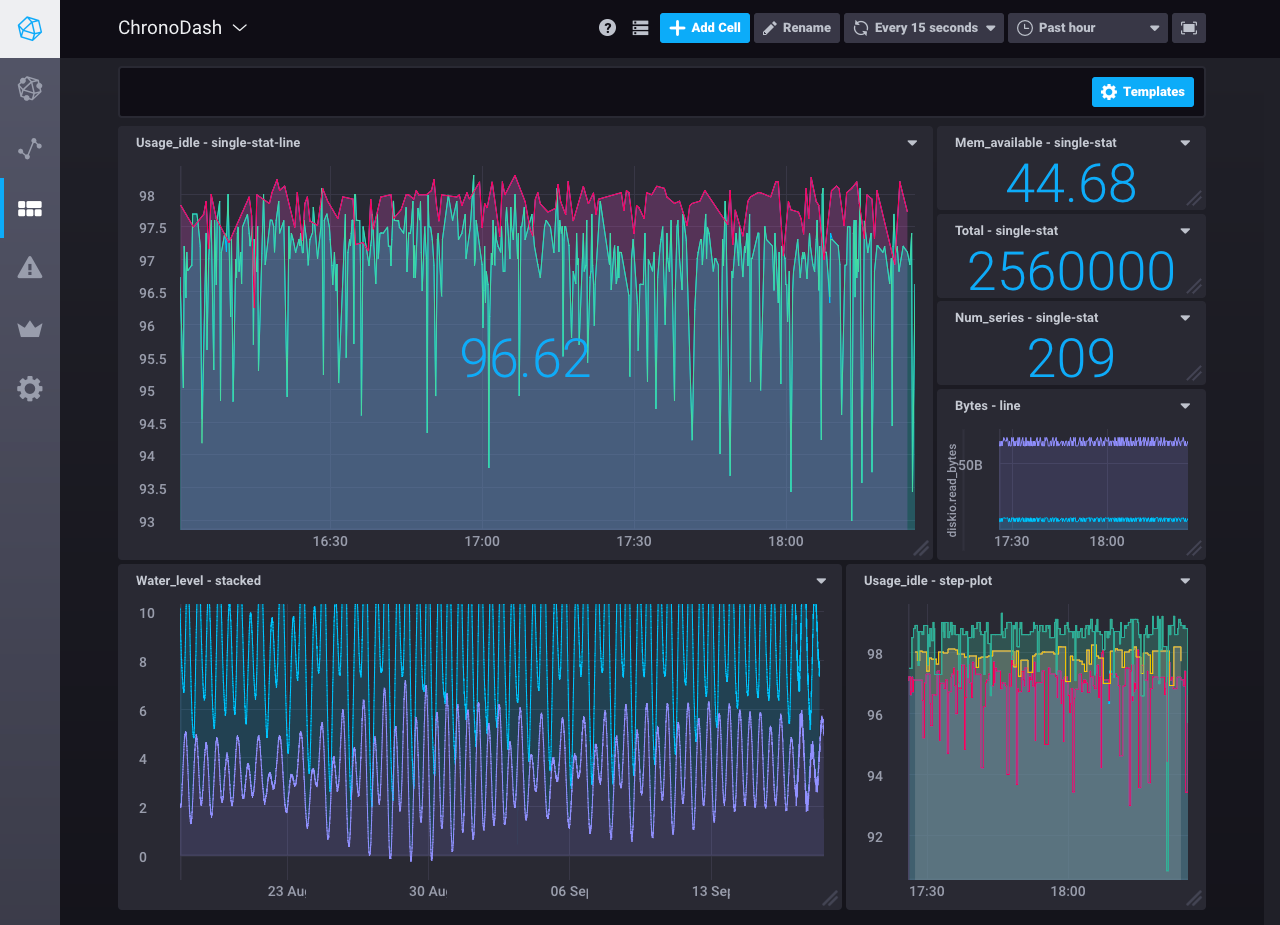
By the end of this guide, you’ll be aware of the tools available to you for creating dashboards similar to this example:
Requirements
To perform the tasks in this guide, you must have a working Chronograf instance that is connected to an InfluxDB source. Data is accessed using the Telegraf system input plugins. For more information, see Configuring Chronograf.
Build a dashboard
Create a new dashboard
Click Dashboards in the navigation bar and then click the Create Dashboard button. A new dashboard is created and ready to begin adding cells.
Name your dashboard
Click Name This Dashboard and type a new name. For example, “ChronoDash”.
Enter cell editor mode
In the first cell, titled “Untitled Cell”, click Add Data to open the cell editor mode.

Create your query
Click the Add a Query button to create an InfluxQL query. In query editor mode, use the builder to select from your existing data and allow Chronograf to format the query for you. Alternatively, manually enter and edit a query. Chronograf allows you to move seamlessly between using the builder and manually editing the query; when possible, the interface automatically populates the builder with the information from your raw query.
For our example, the query builder is used to generate a query that shows the average idle CPU usage grouped by host (in this case, there are three hosts). By default, Chronograf applies the
MEAN()function to the data, groups averages into auto-generated time intervals (:interval:), and shows data for the past hour (:dashboardTime:). Those defaults are configurable using the query builder or by manually editing the query.In addition, the time range (
:dashboardTime:and:upperDashboardTime:) are configurable on the dashboard.
Choose your visualization type
Chronograf supports many different visualization types. To choose a visualization type, click Visualization and select Step-Plot Graph.
Save your cell
Click Save (the green checkmark icon) to save your cell.
Note: If you navigate away from this page without clicking Save, your work will not be saved.
Configure your dashboard
Customize cells
- You can change the name of the cell from “Untitled Cell” by returning to the cell editor mode, clicking on the name, and renaming it. Remember to save your changes.
- Move your cell around by clicking its top bar and dragging it around the page
- Resize your cell by clicking and dragging its bottom right corner
Explore cell data
- Zoom in on your cell by clicking and dragging your mouse over the area of interest
- Pan over your cell data by pressing the shift key and clicking and dragging your mouse over the graph
- Reset your cell by double-clicking your mouse in the cell window
Note: These tips only apply to the line, stacked, step-plot, and line+stat visualization types.
Configure dashboard-wide settings
Change the dashboard’s selected time at the top of the page - the default time is Local, which uses your browser’s local time. Select UTC to use Coordinated Universal Time.
Note: If your organization spans multiple time zones, we recommend using UTC (Coordinated Universal Time) to ensure that everyone sees metrics and events for the same time.
Change the dashboard’s auto-refresh interval at the top of the page - the default interval selected is Every 10 seconds.
Note: A dashboard’s refresh rate persists in local storage, so the default refresh rate is only used when a refresh rate isn’t found in local storage.
To add custom auto-refresh intervals, use the
--custom-auto-refreshconfiguration option or$CUSTOM_AUTO_REFRESHenvironment variable when starting Chronograf.Modify the dashboard’s time range at the top of the page - the default range is Past 15 minutes.
Dashboard templates
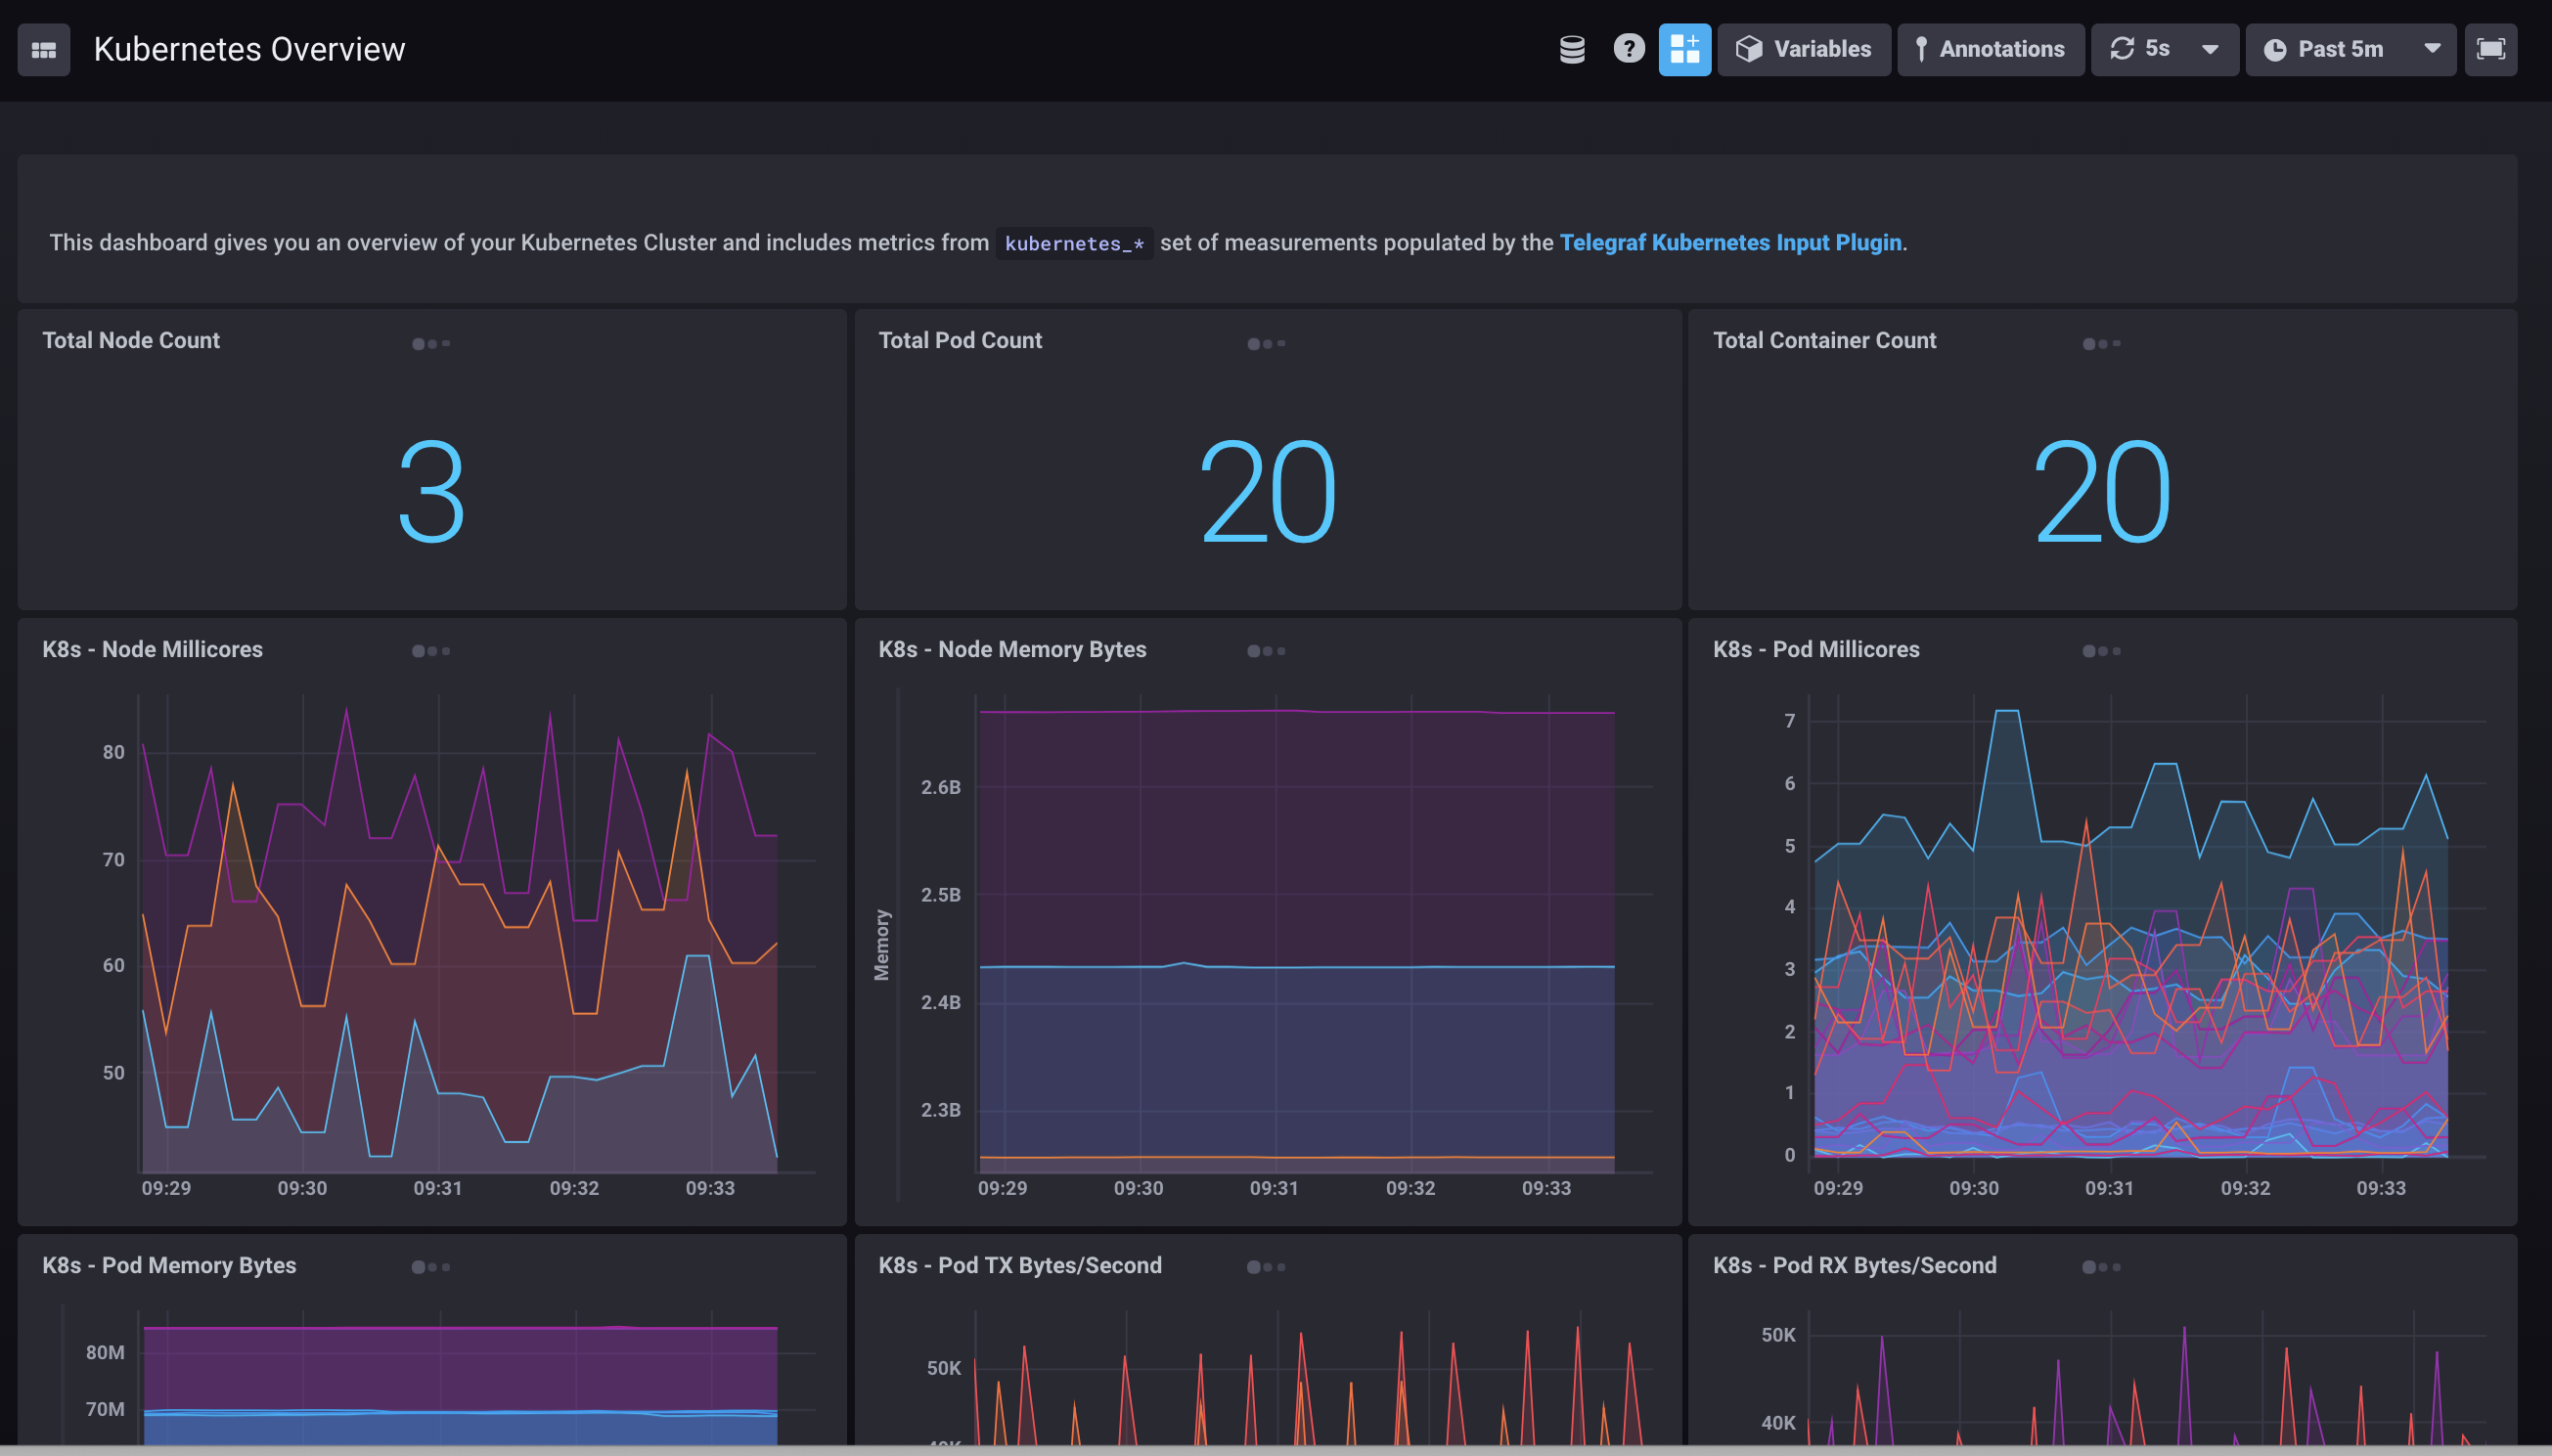
Select from a variety of dashboard templates to import and customize based on which Telegraf plugins you have enabled, such as the following examples:
Kubernetes dashboard template
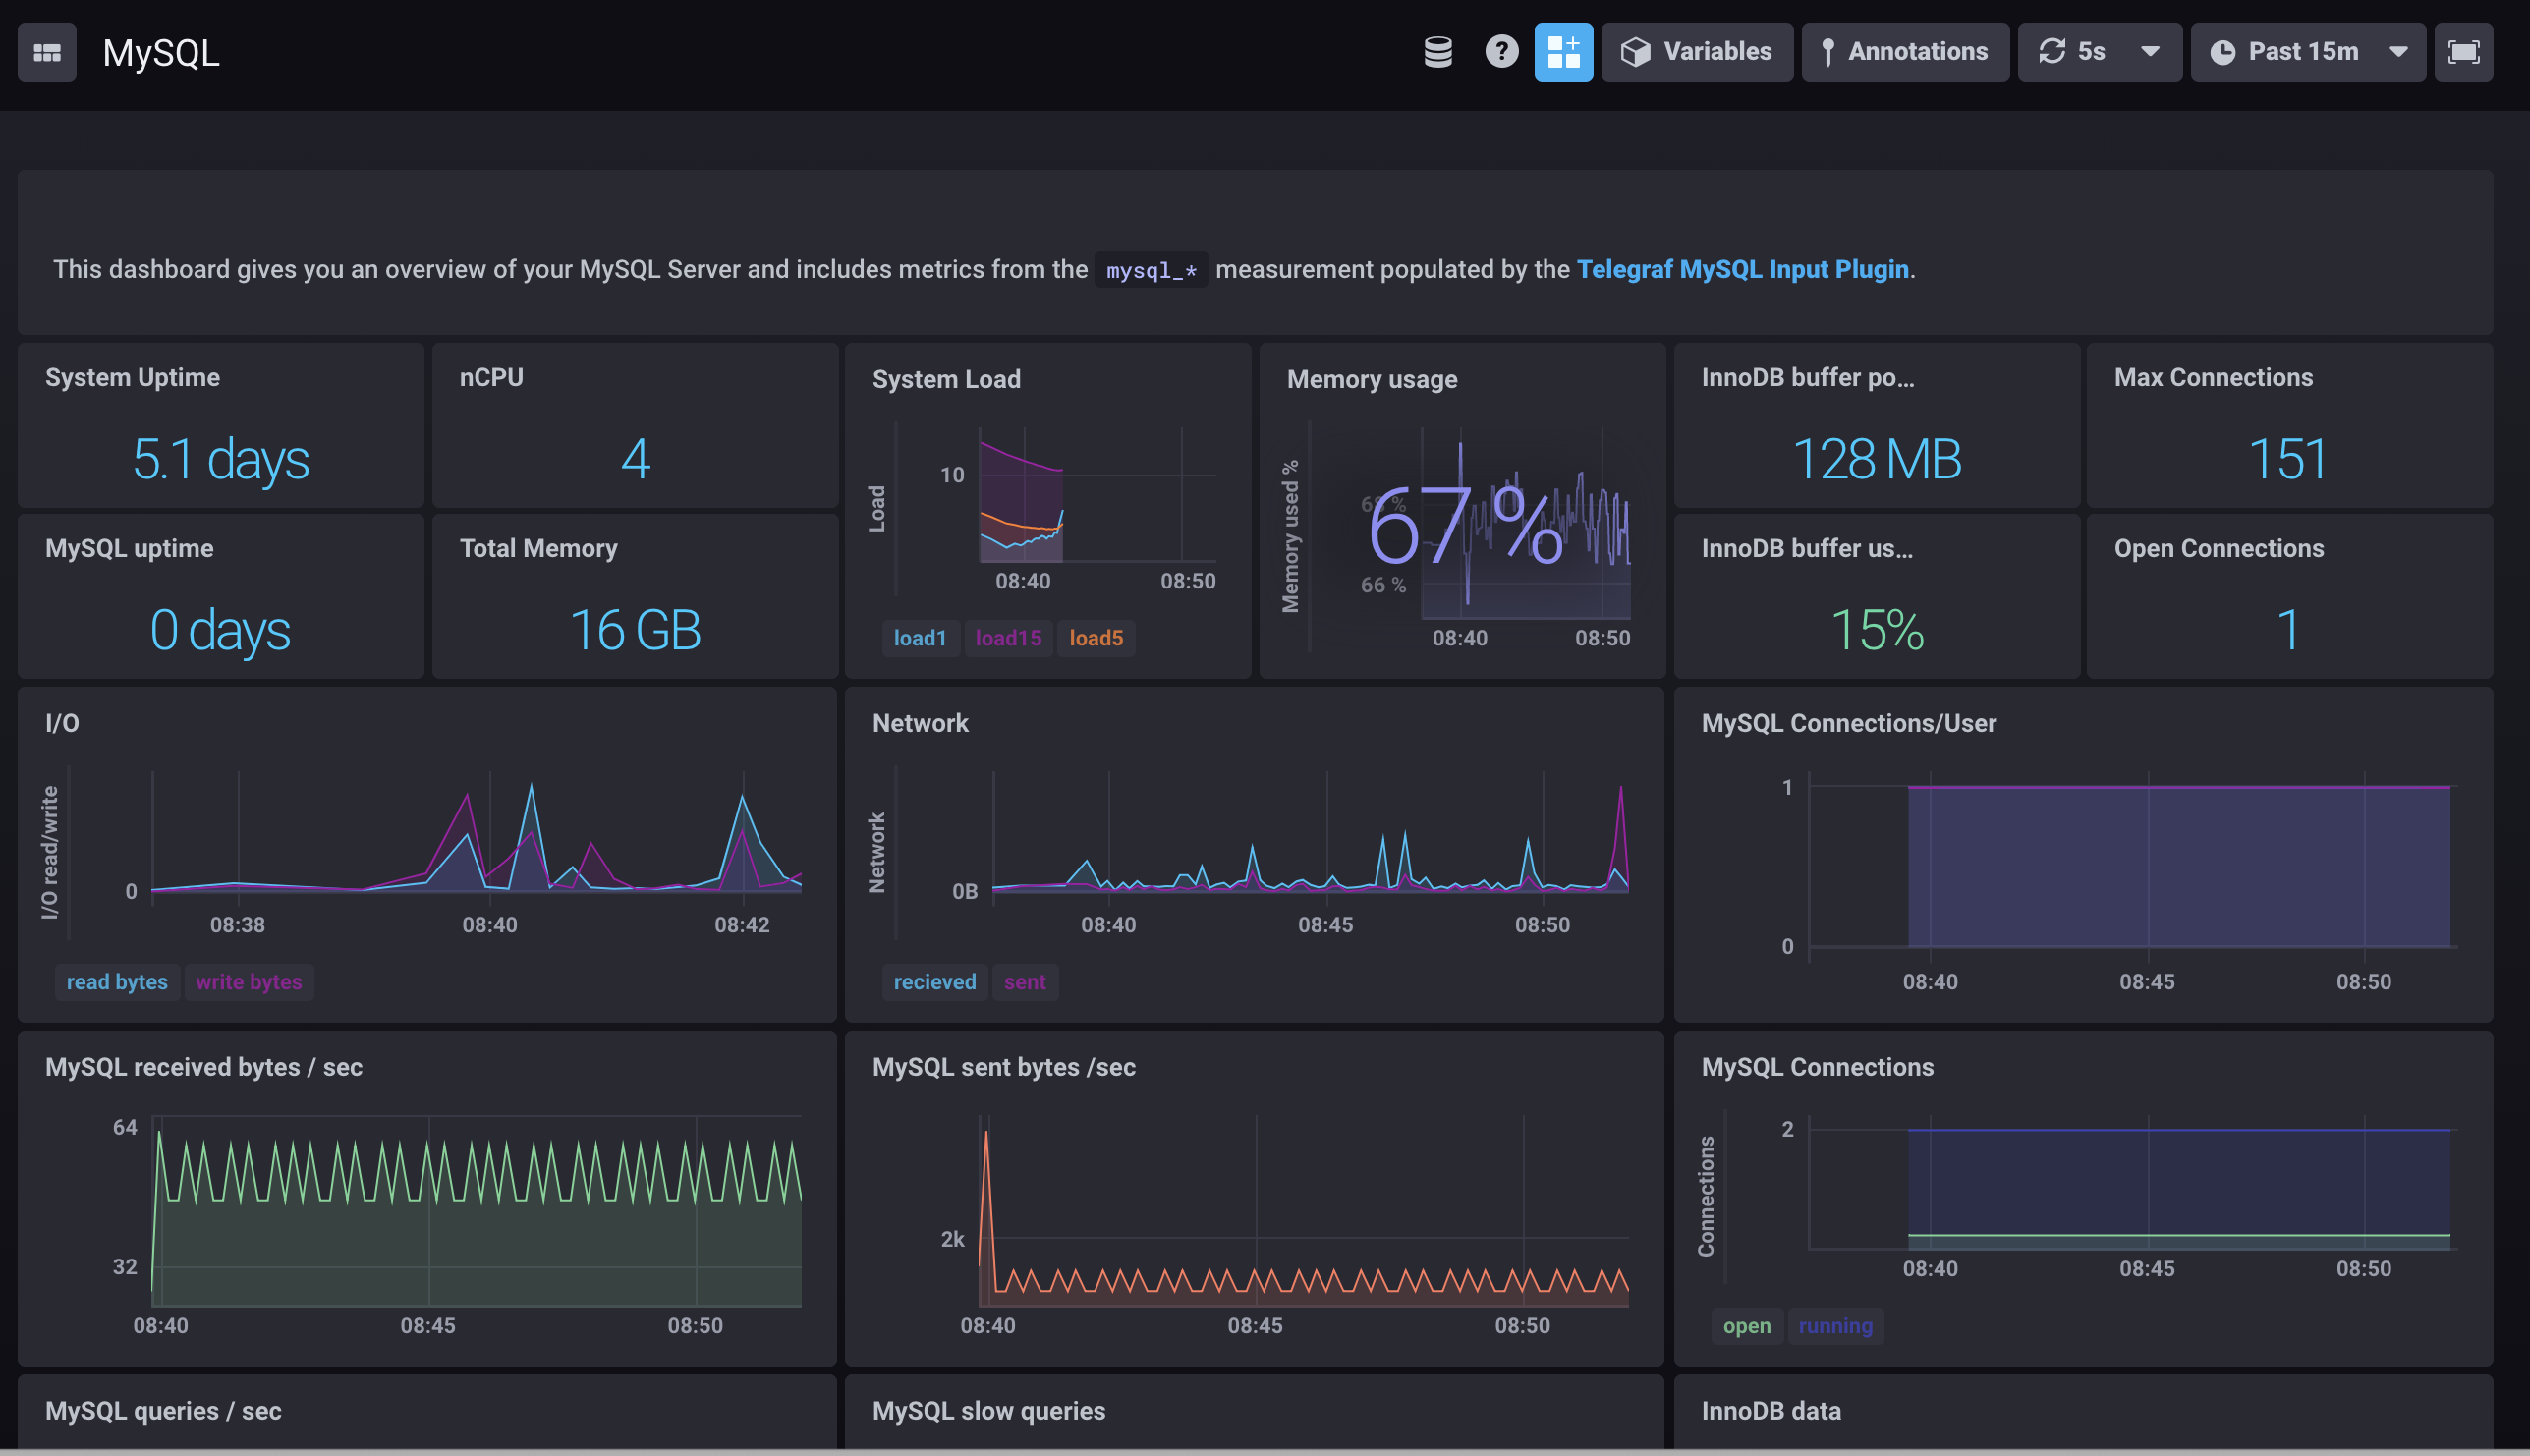
MySQL dashboard template
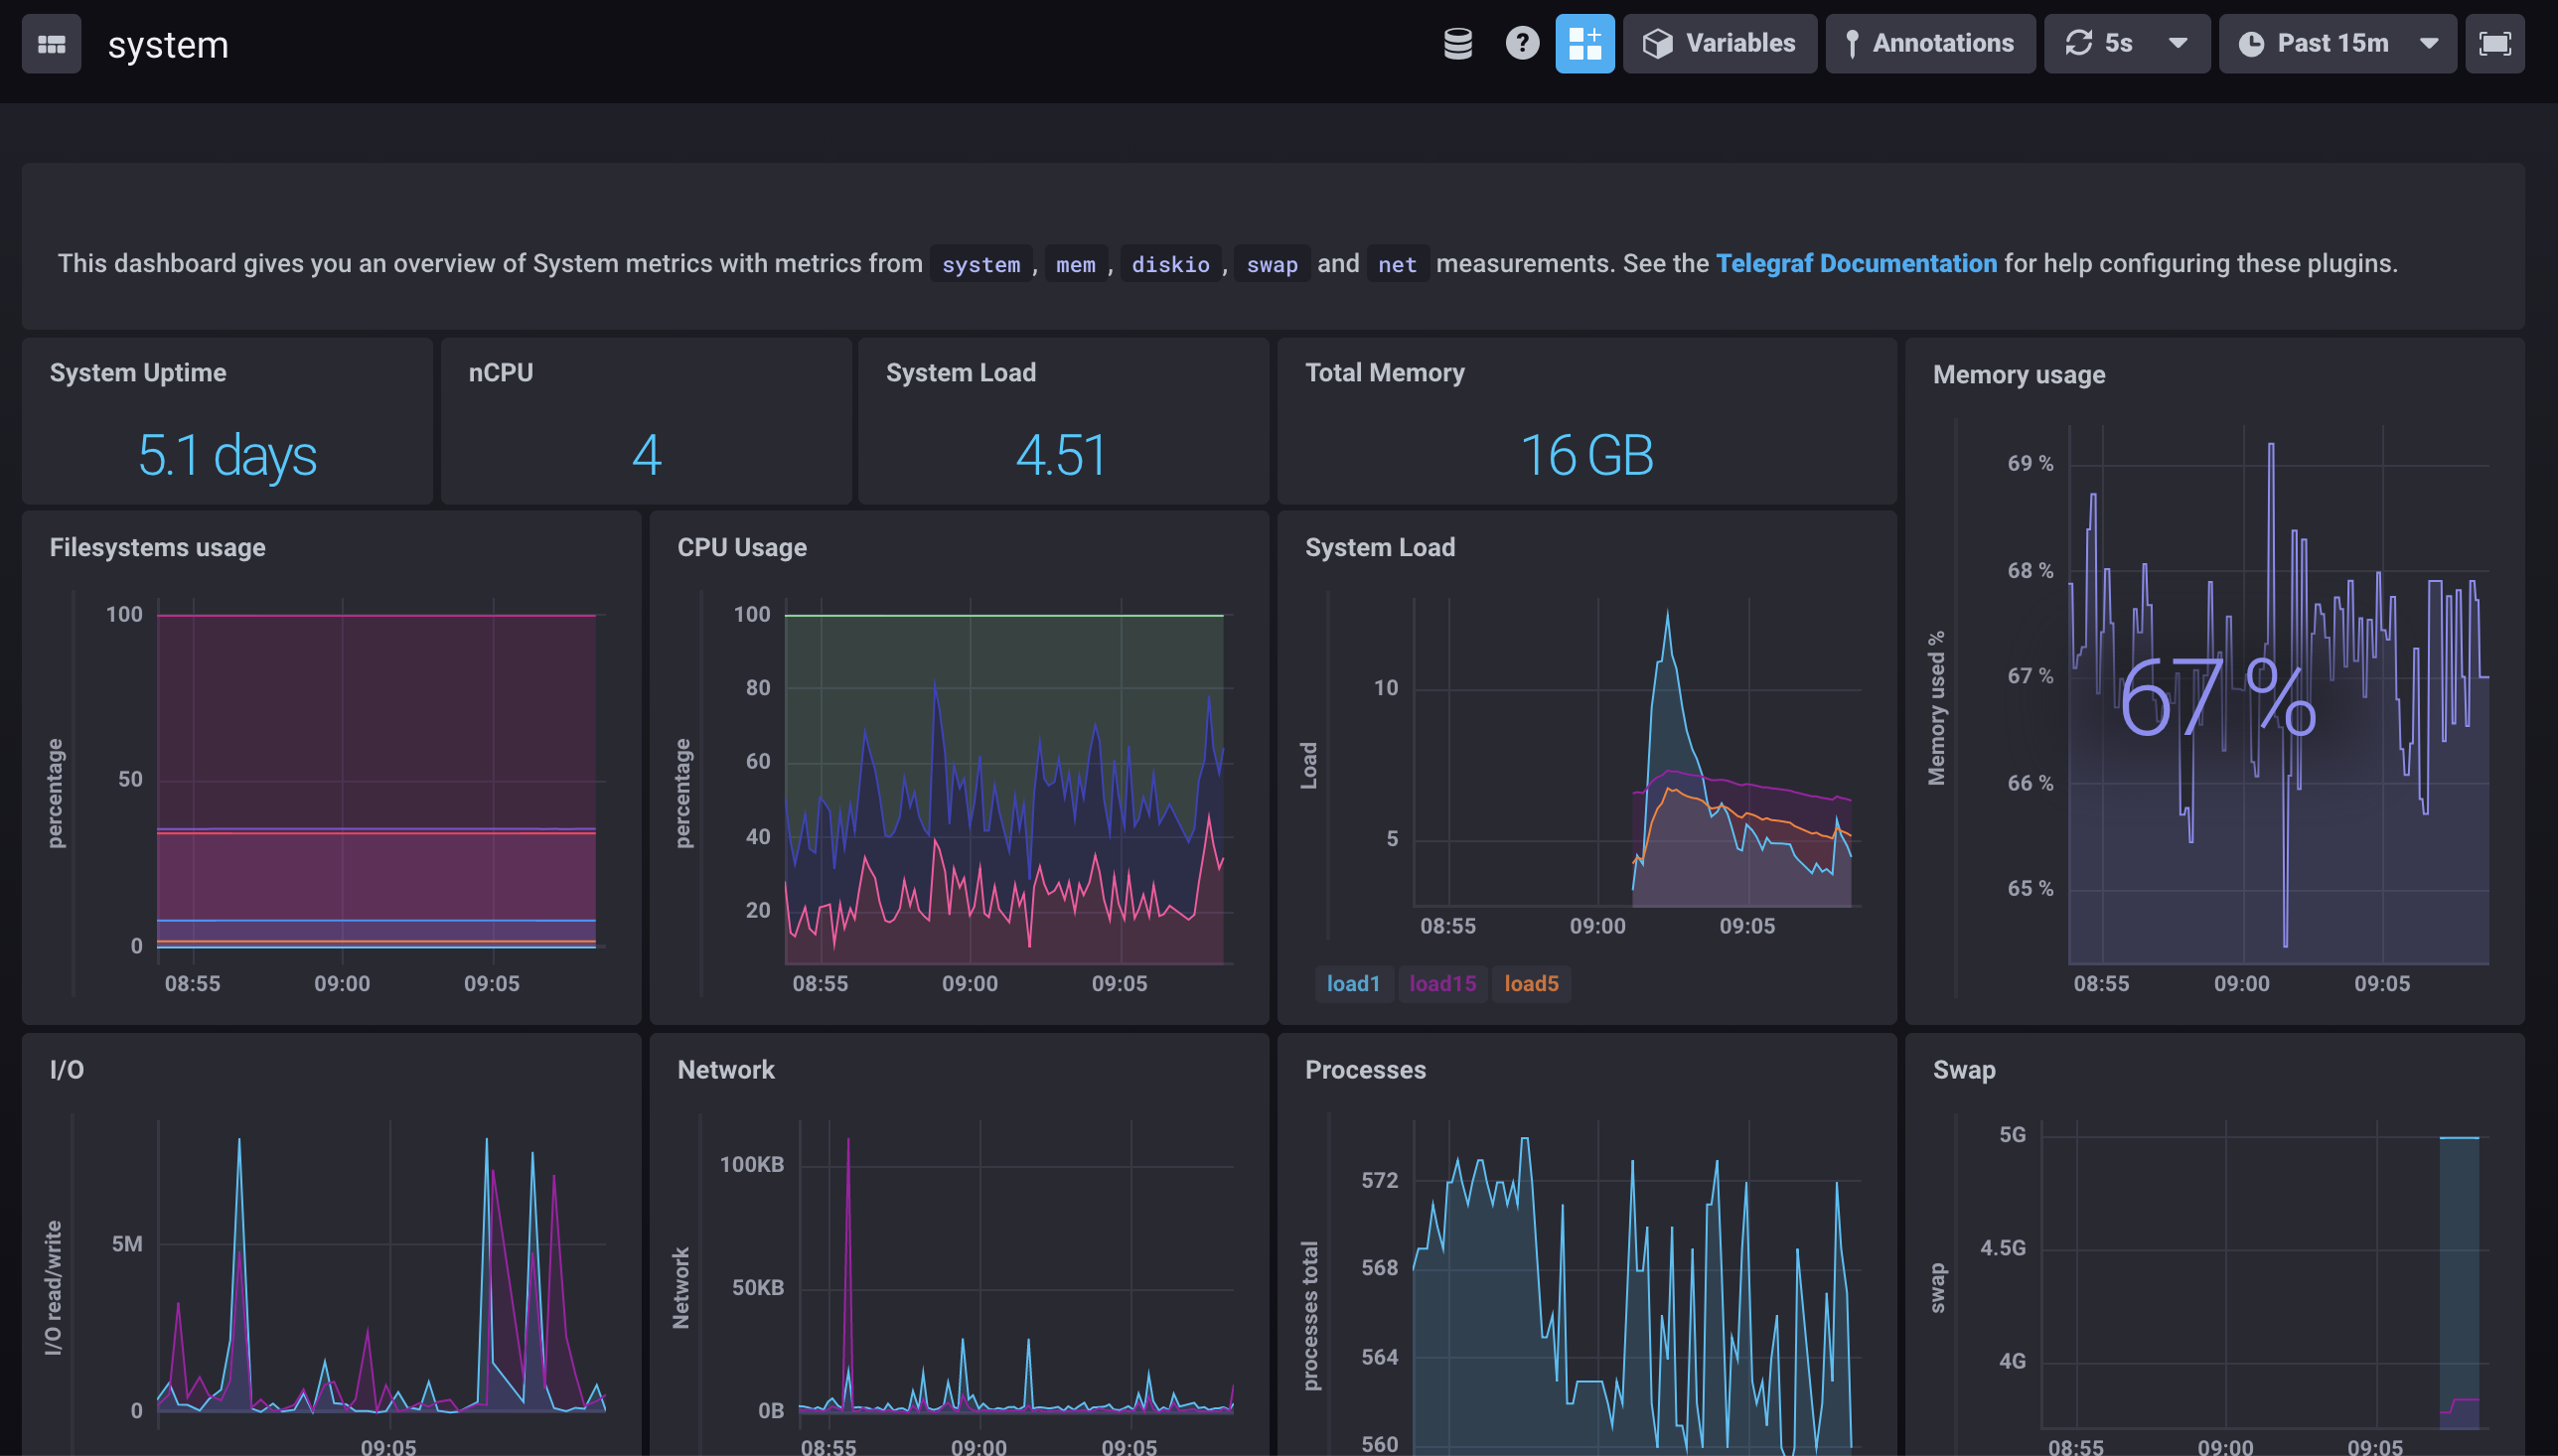
System metrics dashboard template
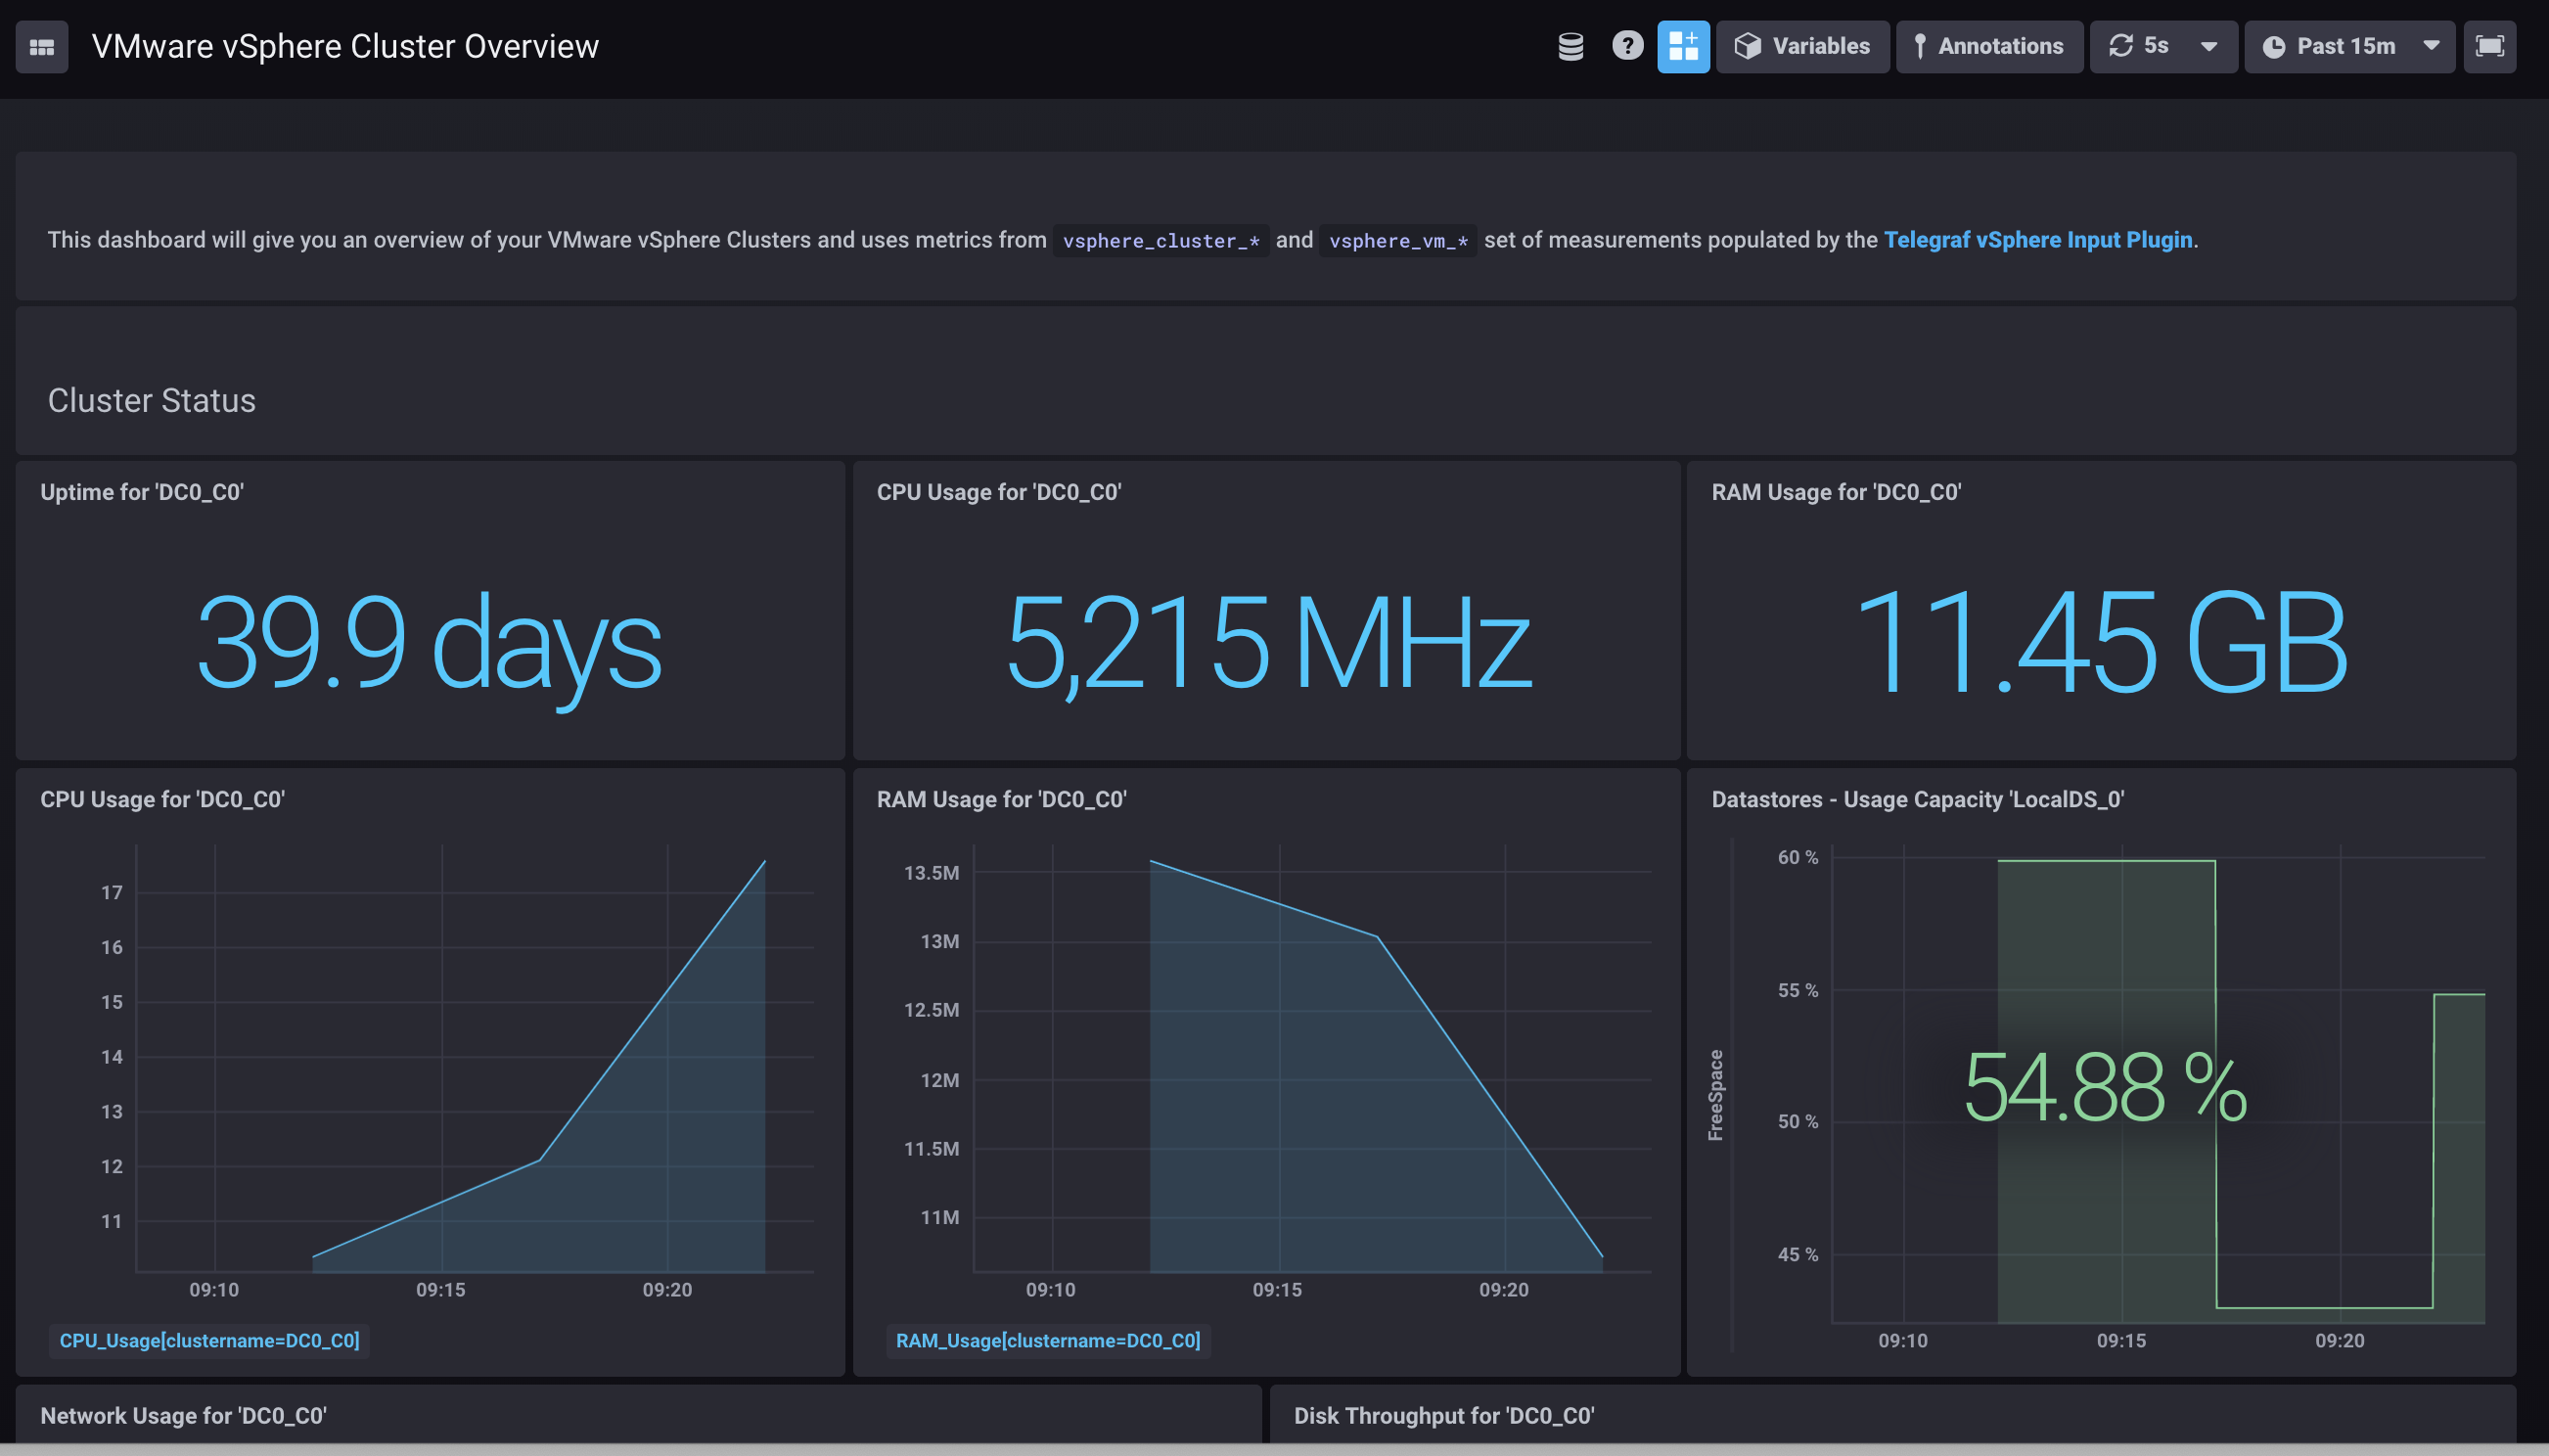
vSphere dashboard template
Import dashboard templates
From the Configuration page, click Add Connection or select an existing connection to edit it.
In the InfluxDB Connection window, enter or verify your connection details and click Add or Update Connection.
In the Dashboards window, select from the available dashboard templates to import based on which Telegraf plugins you have enabled.

Click Create (x) Dashboards.
Edit, clone, or configure the dashboards as needed.
Extra Tips
Full screen mode
View your dashboard in full screen mode by clicking on the full screen icon () in the top right corner of your dashboard. To exit full screen mode, press the Esc key.
Template variables
Dashboards support template variables. See the Dashboard Template Variables guide for more information.
Was this page helpful?
Thank you for your feedback!
Support and feedback
Thank you for being part of our community! We welcome and encourage your feedback and bug reports for Chronograf and this documentation. To find support, use the following resources: