
Analyze logs with Chronograf
Chronograf gives you the ability to view, search, filter, visualize, and analyze log information from a variety of sources. This helps to recognize and diagnose patterns, then quickly dive into logged events that lead up to events.
- Set up logging
- View logs in Chronograf
- Configure the log viewer
- Show or hide the log status histogram
- Logs in dashboards
Set up logging
Logs data is a first class citizen in InfluxDB and is populated using available log-related Telegraf input plugins:
View logs in Chronograf
Chronograf has a dedicated log viewer accessed by clicking the Log Viewer button in the left navigation.
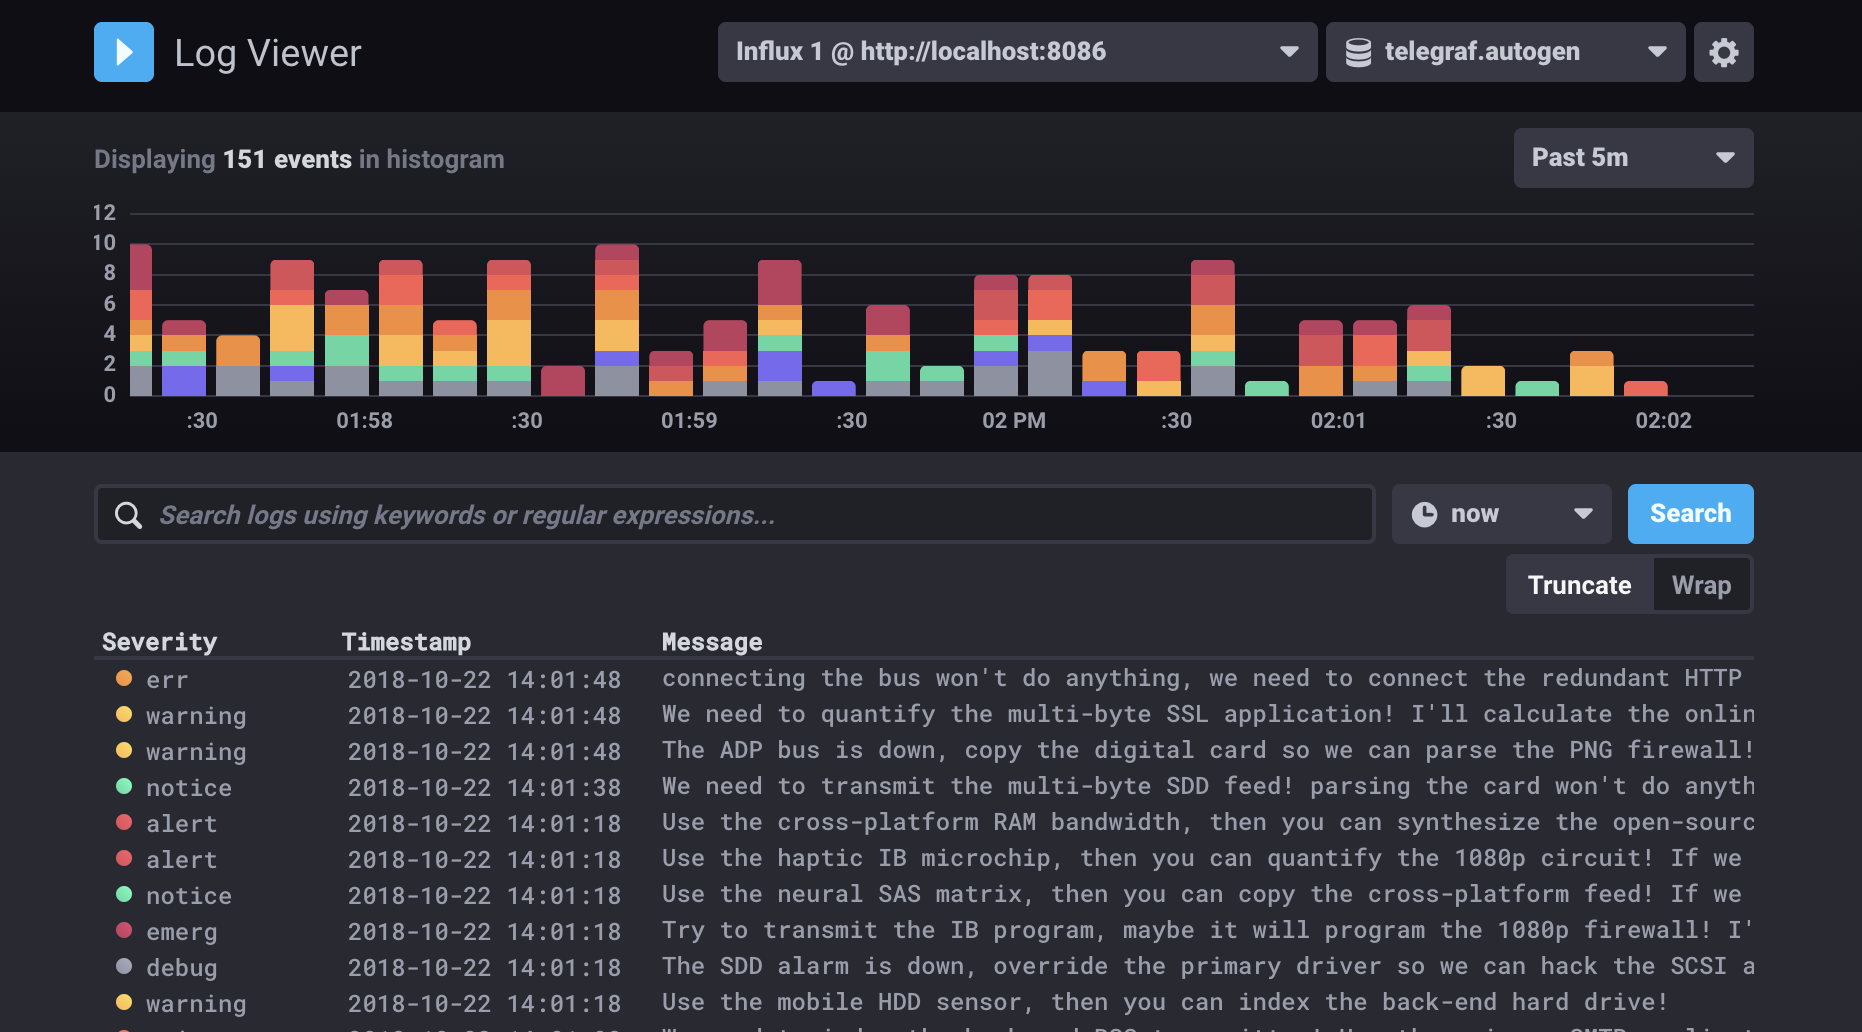
The log viewer provides a detailed histogram showing the time-based distribution of log entries color-coded by log severity.
It also includes a live stream of logs that can be searched, filtered, and paused to analyze specific time ranges.
Logs are pulled from the syslog measurement.
Other log inputs and alternate log measurement options will be available in future updates.
Search and filter logs
Search for logs using keywords or regular expressions.
They can also be filtered by clicking values in the log table such as severity or facility.
Any tag values included with the log entry can be used as a filter.
You can also use search operators to filter your results. For example, if you want to find results with a severity of critical that don’t mention RSS, you can enter: severity == crit and -RSS.
Note: The log search field is case-sensitive.
To remove filters, click the × next to the tag key by which you no longer want to filter.
Select specific times
In the log viewer, you can select time ranges from which to view logs. By default, logs are streamed and displayed relative to “now,” but it is possible to view logs from a past window of time. timeframe selection allows you to go to to a specific event and see logs for a time window both preceding and following that event. The default window is one minute, meaning the graph shows logs from thirty seconds before and the target time. Click the dropdown menu change the window.
Configure the log viewer
The log viewer can be customized to fit your specific needs. Open the log viewer configuration options by clicking the gear button in the top right corner of the log viewer. Once done, click Save to apply the changes.
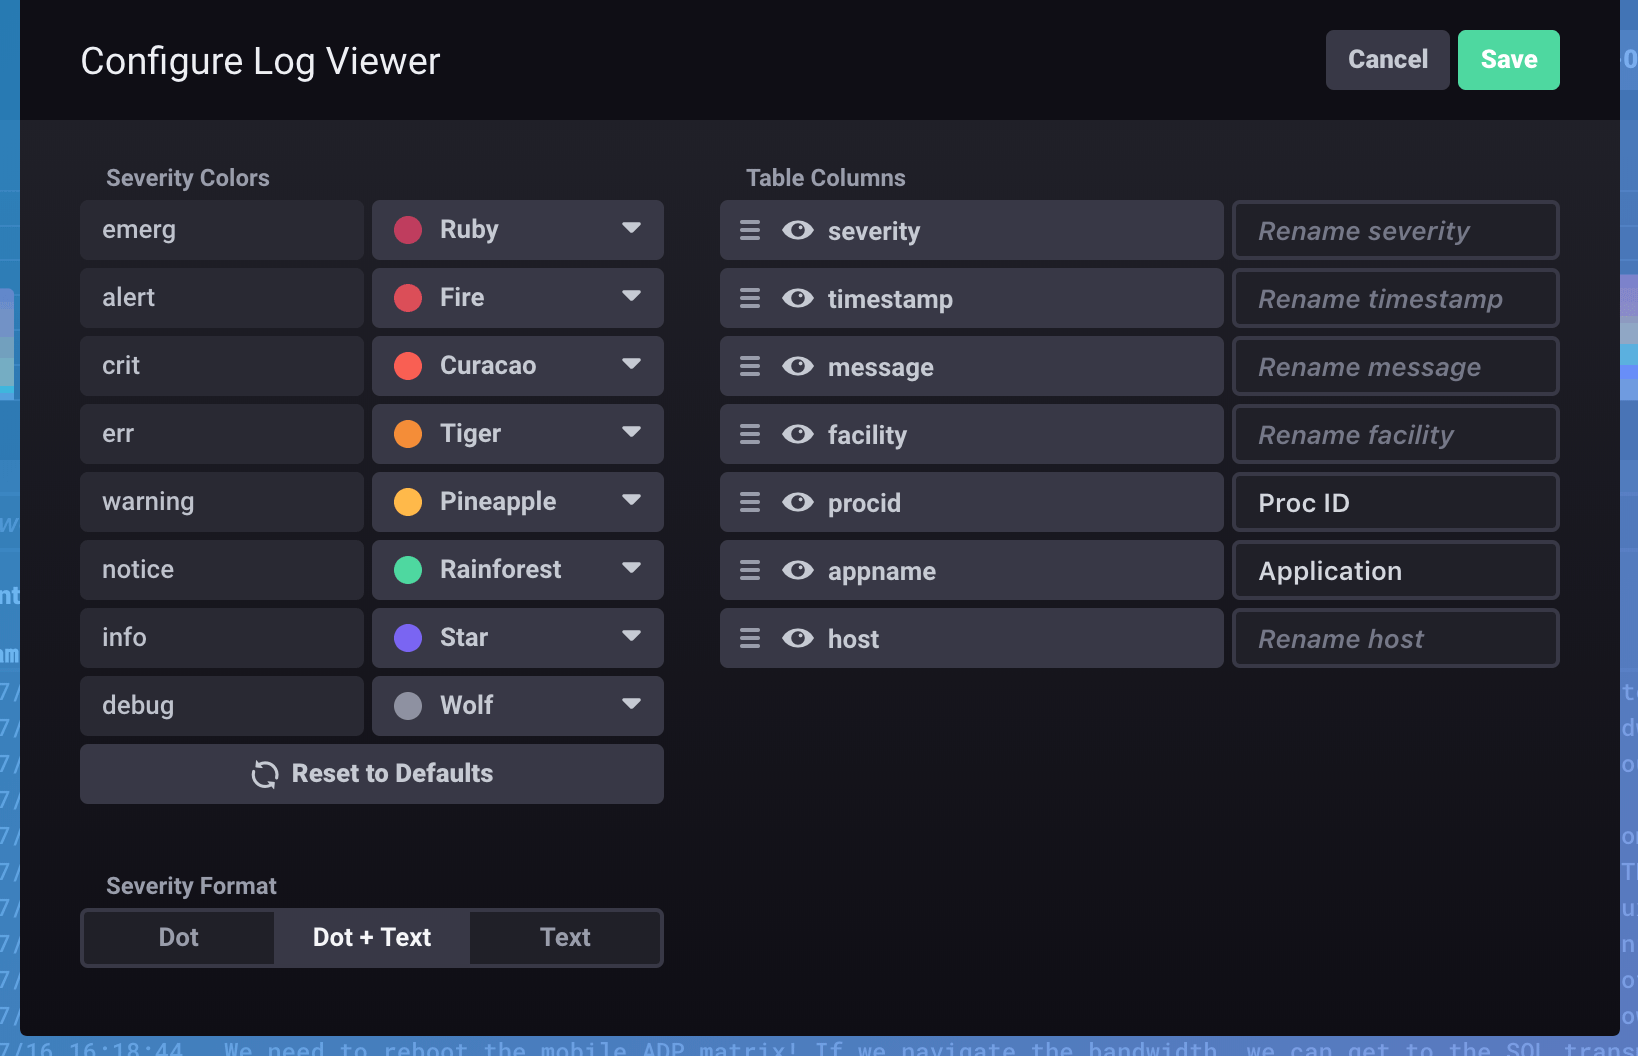
Severity colors
Every log severity is assigned a color which is used in the display of log entries. To customize colors, select a color from the available color dropdown.
Table columns
Columns in the log viewer are auto-populated with all fields and tags associated with your log data. Each column can be reordered, renamed, and hidden or shown.
Severity format
“Severity Format” specifies how the severity of log entries is displayed in your log table. Below are the options and how they appear in the log table:
| Severity Format | Display |
|---|---|
| Dot |  |
| Dot + Text |  |
| Text |  |
Truncate or wrap log messages
By default, text in Log Viewer columns is truncated if it exceeds the column width. You can choose to wrap the text instead to display the full content of each cell.
Select the Truncate or Wrap option to determine how text appears when it exceeds the width of the cell.
To copy the complete, un-truncated log message, select the message cell and click Copy.
Show or hide the log status histogram
The Chronograf Log Viewer displays a histogram of log status.
To hide the log status histogram, click the icon in the top right corner of the histogram.
To show the log status histogram, click the icon in the top right corner of the log output.
Logs in dashboards
An incredibly powerful way to analyze log data is by creating dashboards that include log data. This is possible by using the Table visualization type to display log data in your dashboard.
This type of visualization allows you to quickly identify anomalies in other metrics and see logs associated with those anomalies.
Was this page helpful?
Thank you for your feedback!
Support and feedback
Thank you for being part of our community! We welcome and encourage your feedback and bug reports for Chronograf and this documentation. To find support, use the following resources: